In this article we will have a look a how we can setup data-drive object coloring in our BIM files, using Vcad.
In this example we will be using the forge viewer version of Vcad with a Revit file, but the functionality remains the same with any file type using the forge viewer.
Scenario
For this example, let’s image we have a BIM model of a building and an external data-source that provides information about installation progress of some equipment in our building.
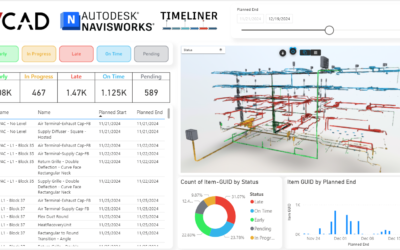
The objective is to create a report with an interactive rendering of our BIM model and to color the objects of our model based on their installation status. This will allow the report user to identify at a glance which equipment has been fully installed in our building and which must still be started.
Procedure
Here are the steps we will be executing to create our report:
- Download a preconfigured Power BI template based on the BIM file.
- Imports and transform the external data-source.
- Configure the color theming.
- Complete the report.
Downloading the Power BI template
First, we must download the preconfigured Power BI template from the Vcad portal.
This step is described in this article, so we won’t go through it here.
At the end of this step, we will have a preconfigured Power BI template, setup with the model’s and the Vcad custom visual configured to render the model.
Now we simply need to open the template using the Power BI desktop application.
Getting the external data
This step will vary depending on the nature and structure of the external data to import in the report.
Import installation progress data
In this example we are importing information on the installation status of railings and grab-bars in a hospital. The information is stored in a file called “installation_progress.csv” which we can import using the Home -> Get Data button in Power BI Desktop, this will add to our report a new dataset called installation_progress.
For simplicity, the dataset includes the objectId, the property used to link the rendered model with the rest of the report data, however this connection may be based on several other parameters like the object name of any of the defined properties.
The imported file, in .csv format, is structured as follows:
- objectId: reference to the model object id, generated by Forge when processing the model.
- progress: an integer value between 0 and 100, which provides the percentage of progress on the equipment installation.
- startDate: the date on which the installation began. May be empty.
- endDate: the date on which the installation was completed or considered usable. May be empty.
Create installation levels table
To assign colors to the model assets we should define a categorization of the objects based on their completion status. To do so, let’s create a dataset that lists the various installation levels and a color to represent them.
To add this dataset, we can simply open the Power Query Editor by using the Home -> Transform data button, and then add a new dataset by clicking on Home -> Enter Data.
Now we can define our installation_levels dataset with our installation level classification. In this example we will define four levels based on 25% increments of level completion.
It is important that the dataset include:
- A level identification column: which can simply be an incremental integer.
- A hex color code column, which will be used later to apply the color to assets in the model.
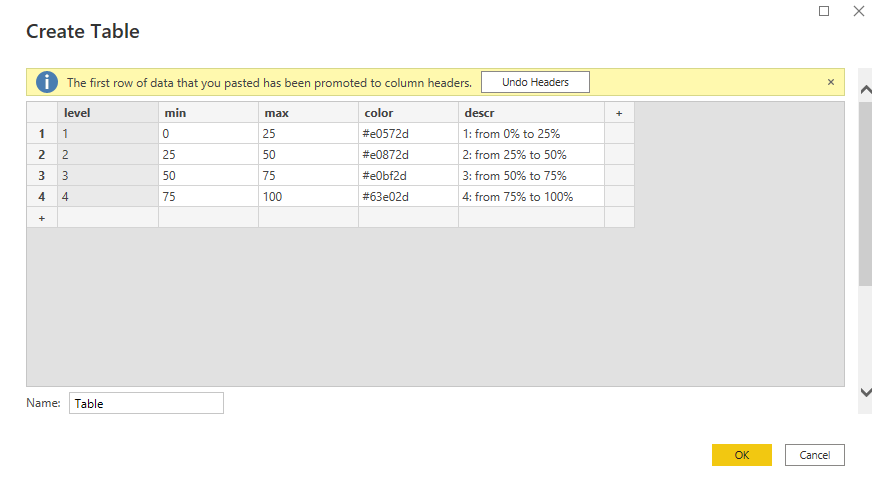
NOTE: The rest of the columns shown in the image are extra information for flavor and formatting purposes.
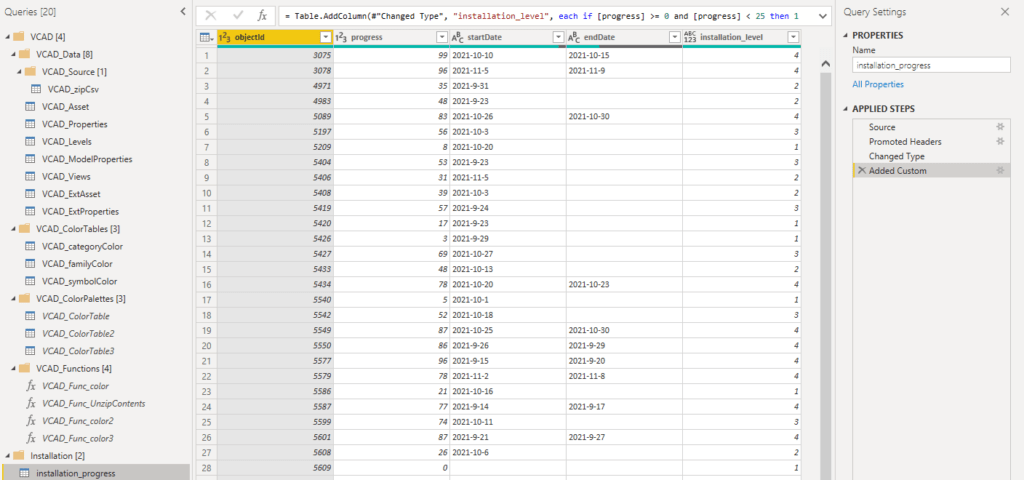
Transform installation progress data
Now that we have imported our installation progress data and defined installation level colors, we have to apply the necessary transformations to be able to connect the two.
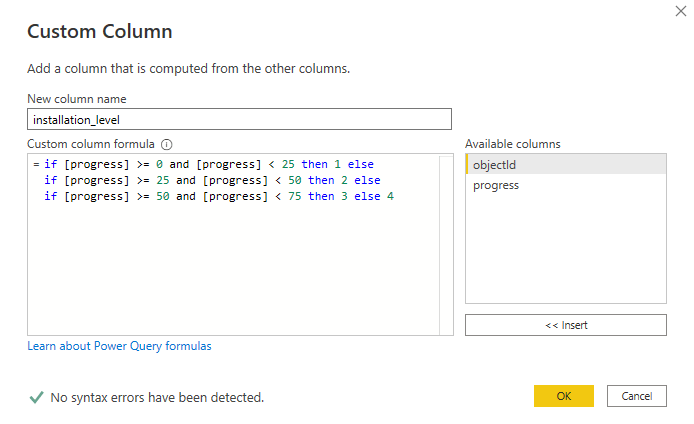
To do so, we can select the installation_progress dataset and then click on the Add Column -> Custom Column button. This will open the column creation window where we can define the formula for our custom column, which we will call installation_level.
The column we add will then be matched with the level identification column from the installation_levels dataset.
For our example the following formula will work:
 if [progress] >= 0 and [progress] < 25 then 1 else
 if [progress] >= 25 and [progress] < 50 then 2 else
 if [progress] >= 50 and [progress] < 75 then 3 else 4
Link the datasets
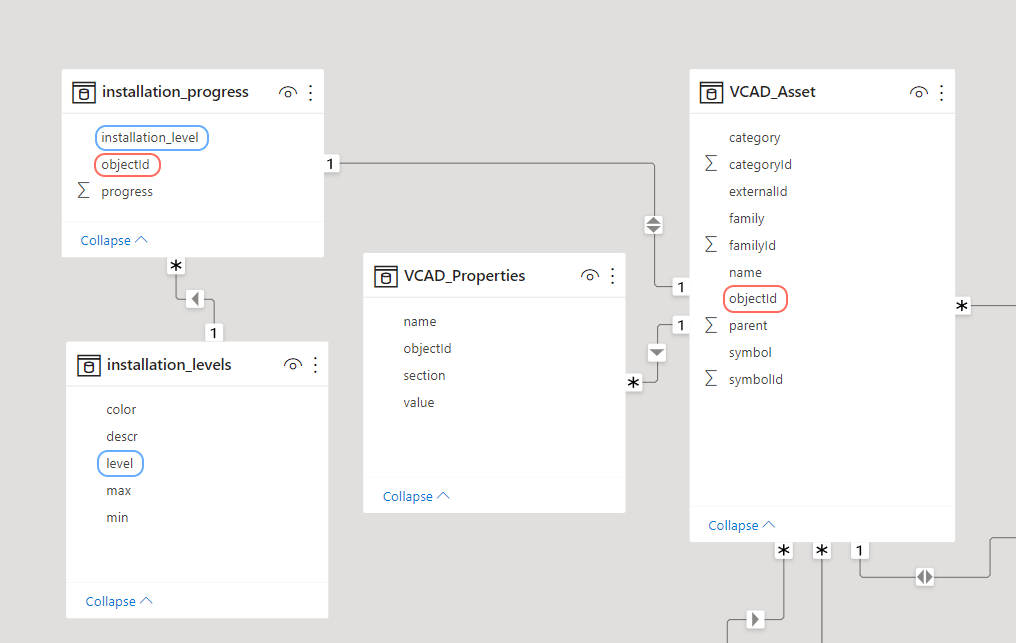
At this point we are able to connect our two new datasets using Power BI’s Model View.
The following relationships must be added:
- Installation_progress – VCAD_Assets: A one-to-one relation using the objectId columns from each dataset. This relation will connect the installation information to the automatically extracted data from our BIM file.
- Installation_progress – installation_levels: many-to-one relation using the installation_level and level This relation will connect the defined colors to the installation progress information.
Configuring the Vcad custom visual
Now that the data has been imported and correctly linked, we can proceed with configuring the color theme.
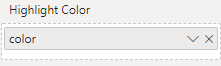
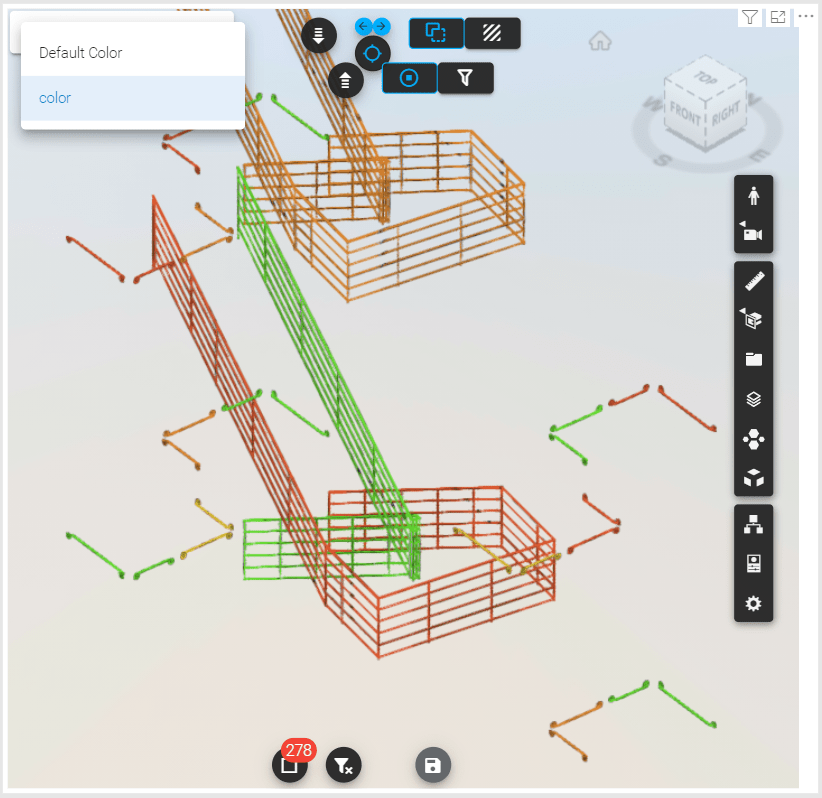
To do so, we can select the custom visual and head to the Format panel and then activate the Show Theme Color option. This will activate a drop-down menu on the top-left corner of the visual, that can be used to select the current coloring theme.
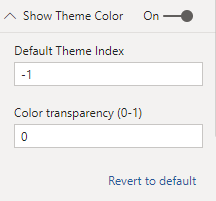
Finally, we can switch to the Fields panel and drag our color column from the installation_levels table to the Highlight Color field.
Completing the report
At this point we are good to go.
By using the theme selector within the visual we can apply the new themes to the model, and by adding slicers and filters to the report we can easily filter and focus on the elements being analyzed.
Conclusion
In this article we showcased how we can add colors to our BIM model to convey additional data in our reports.
For a step-by-step video guide have a look at the video below.