Power BI tooltips are a simple and elegant way to display more contextual data and detailed information.
In the following article, we will see how we can easily gain more insight at a glance by using Power BI’s report tooltips in combination with Vcad.
ENABLING TOOLTIPS
First of all it is necessary to enable the “Show tooltip on mouse over” option. This can be done by selecting the Vcad custom visual within the report and navigating to the “Selection Options” section of the “Format” panel.
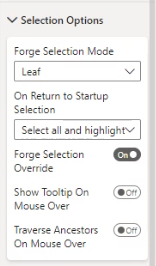
This option will tell the Autodesk Forge viewer to render a tooltip when we are hovering over a geometry and not only over markers. We will talk about markers in more detail in future articles.
TOOLTIP SETTINGS
Now let’s take a look at the standard Power BI tooltip options, found in the “Tooltip” section of the “Format” panel.
The tooltip options allow us to change the font, colour and appearance of the tooltips and to set their type.
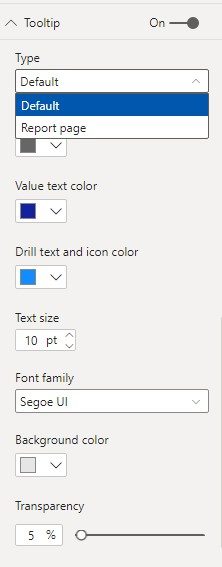
Default Tooltip Type
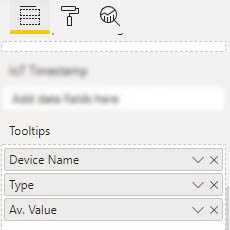
The “Default” type allows us to display, within the tooltips, any data we may want. To do this, simply add the desired fields to the “Tooltips” field in the Power BI “Fields” panel.
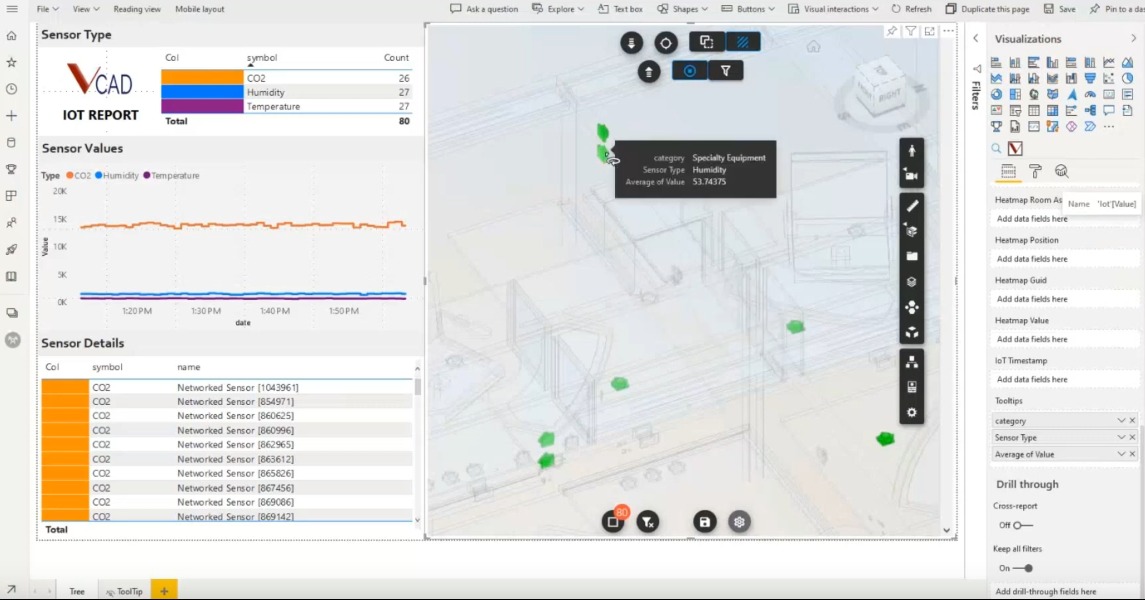
When choosing the “Default” tooltip type, we will end up with a similar result as the one in the next image.
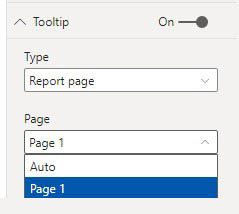
Report page Tooltip Type
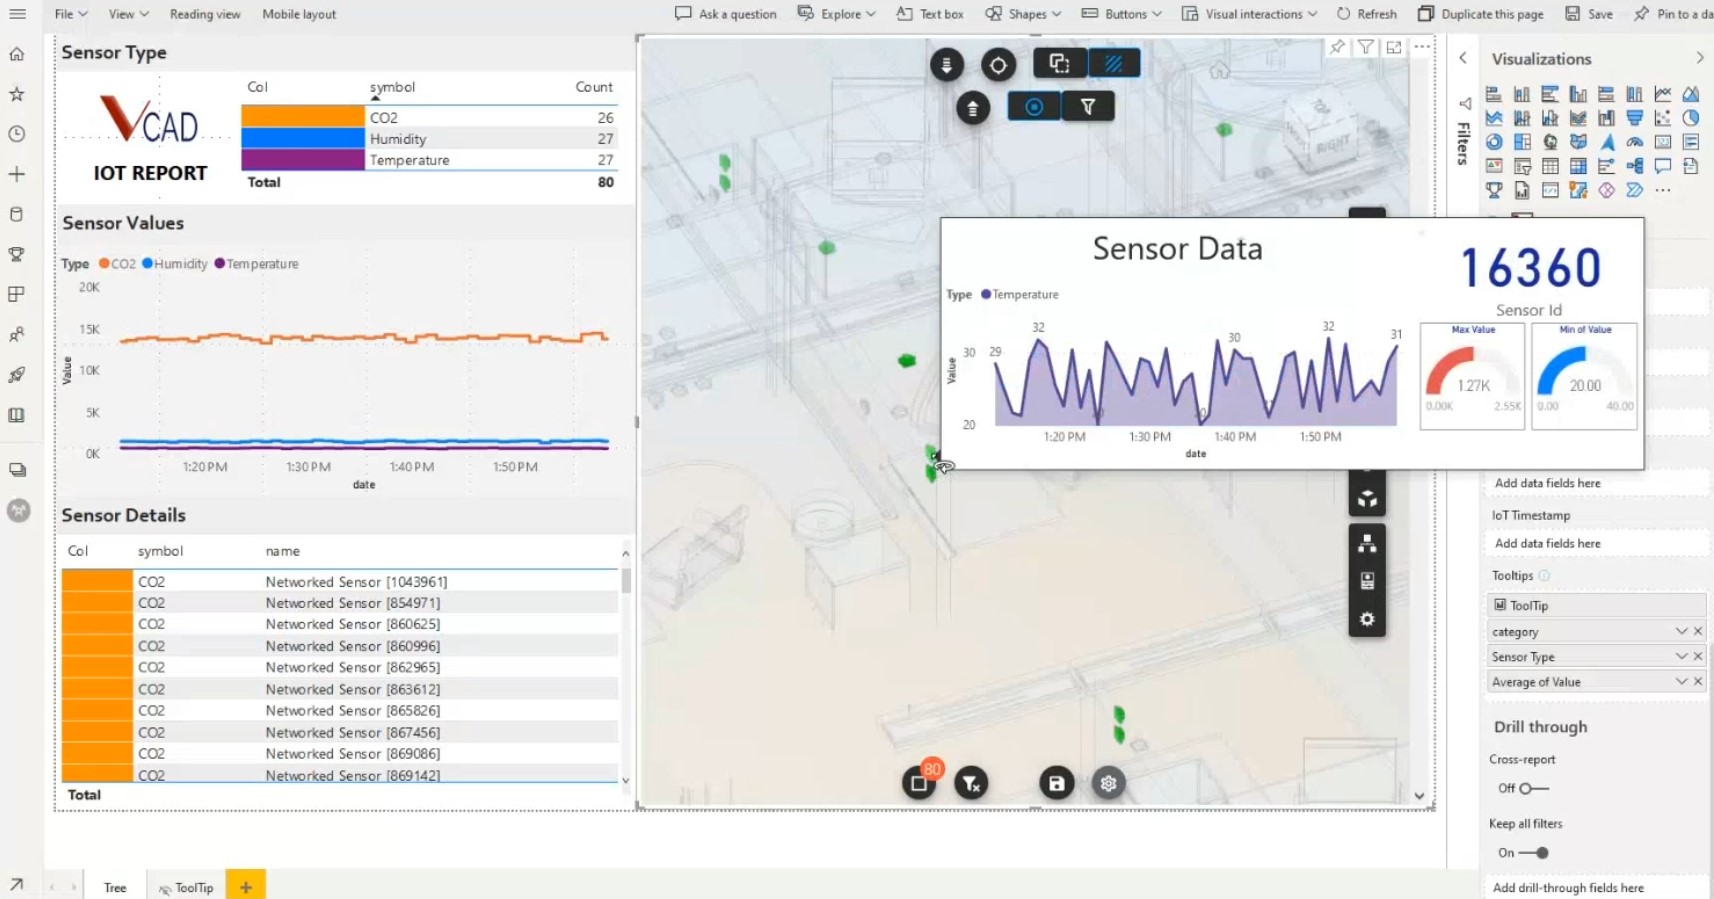
Selecting the “Report page” type will allow us to select one of the Power BI report pages to display in our tooltips. This means that, on mouse hover, the report on the selected page will be displayed in the tooltip showing us all the visuals, filtered based on the item we are hovering over.
This will be the result.
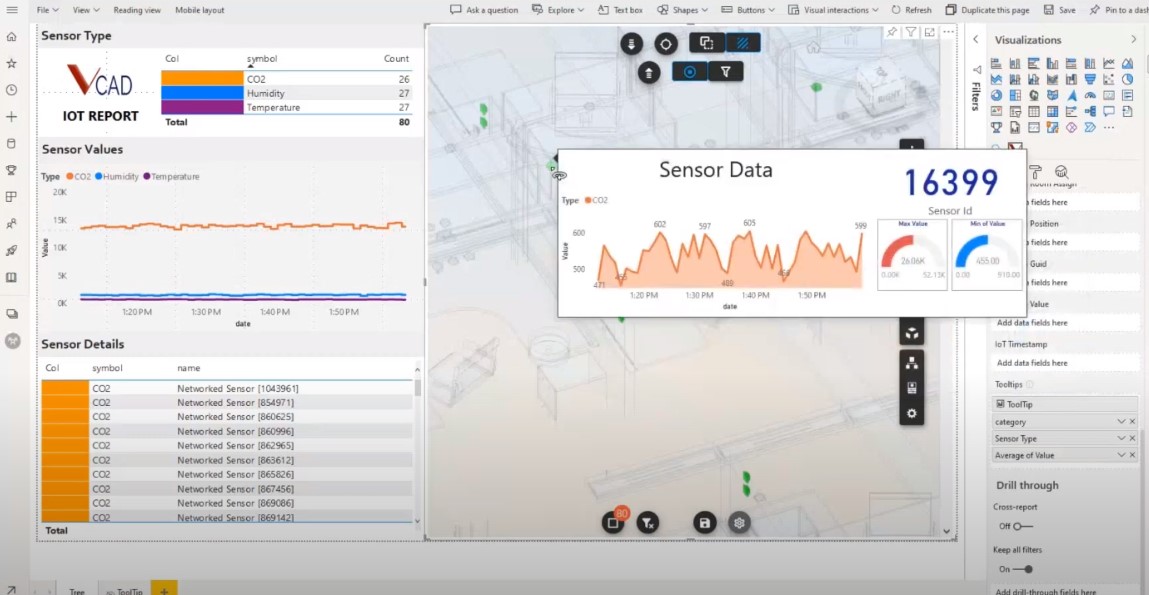
The video below shows how to correctly configure the tooltips and all possible options to make the most of this functionality.

