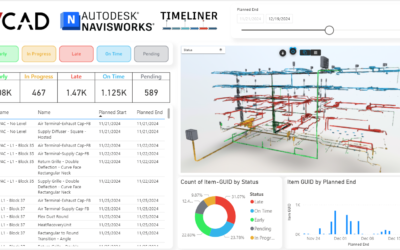
Thanks to the new version of the Vcad template* dedicated to Navisworks Clash Detection, it is possible to display in a Power Bi report the results of tests performed in Navisworks.
Navisworks does not provide an efficient way to share the results with other users, the current possibilities are to create static reports or share the Nwc/Nwd file, so very limited possibilities for sharing with a work group.
The advantages of using Vcad and Power BI for Clash Detection analysis are many:
- Ability to share Clashes through Power BI Dashboards, including sharing and security policies that can go down to the single row level
- Ability to interact with the live model in the viewer, with a set of tools – zoom, filters, xray, isolation – that are not present in Navisworks’ native export formats
- Ability to extract, transform and integrate data
- Possibility of creating an infinite number of dashboards with focus on disparate aspects of the discipline through the use of BI tools
General Principles
To use the Clash report, it is necessary to use the xml file obtained from the Clash export procedure in Navisworks.
The limitations of Navisworks export tools and the nature of the data itself makes the process of associating clash data with the graphical elements of the model a task that is not simple and straightforward. For this reason, it is critical to understand what the association mechanisms are, how to configure the xml file export, and how to set up the PBI template.
The most important aspect to highlight is that The Xml file, by its nature, does NOT contain a unique identification of the objects that are involved in Clash Detection: in fact, there is no Id or guid that allows us to identify – outside Navisworks – in a clear and punctual way the elements that participate in the Clash.
The best way to associate clash elements with geometries is by exposing the exported attributes in the Xml file through the mechanism called Quick Properties in Navisworks. Similarly, the same attributes will be extracted from the Bim model via Vcad and compared to those in the Xml file. From that comparison we will be able to associate the Clash elements with the model geometries and then use them together in the Power BI report. Therefore, it is important to emphasize that the more the attributes exported in the Xml file uniquely characterize the element, the more precise the association with the corresponding geometry will be.
Important: in some cases, related to specific features of the Navisworks model, there will be elements that are identical in terms of characteristics and attributes and therefore in the report there will be more objects associated to the single Clash item.
This situation will be clearly highlighted in the report and, in any case, the Clash marker will always be correctly positioned, thus allowing the correct visual identification of the Clash.
How to export the Clash Xml file from Navisworks
The following will explain the procedure for exporting the Cash data in xml format.
Quick Properties Configuration
The type and number of attributes that will be present in the xml file is related to the ‘Options/Interface/Quick Properties/Definitions’ configuration.
From here it is possible to configure a collection of parameters consisting of the Category/Property pair that will define which properties of the elements, present in the model, will be exported in the xml file associated with the clash elements.
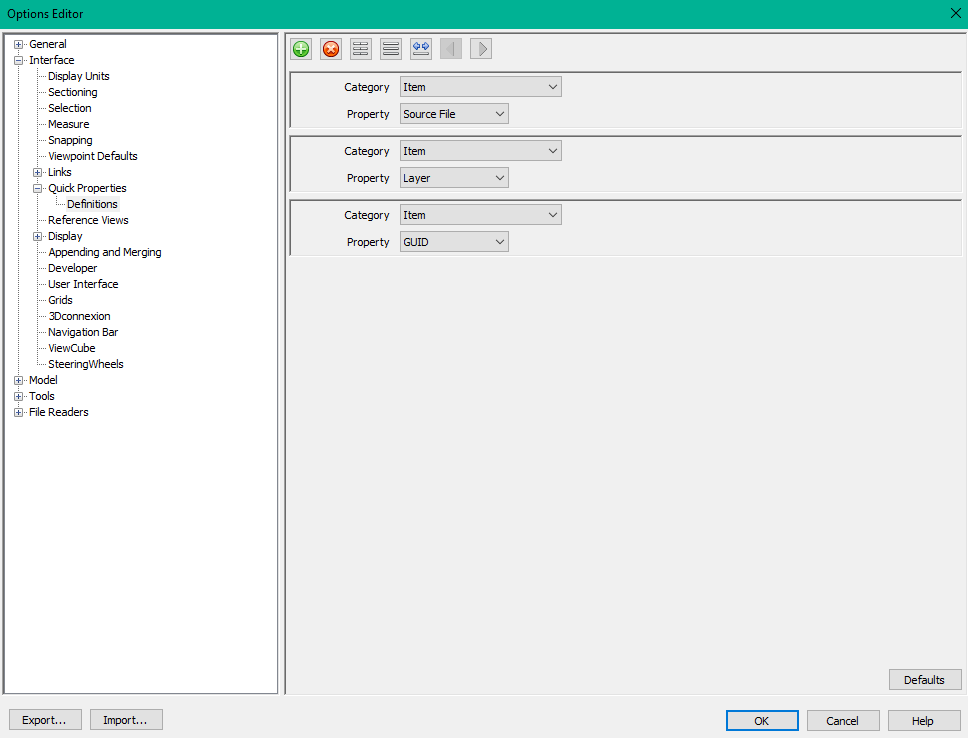
The configuration that is used by default in our Power BI template is represented by this triplet of values:
![]()
![]()
This configuration seems to work well with most Navisworks models as these attributes are often present in all elements and are therefore able to uniquely describe the elements themselves.
Of course, not all models will be structured in the same way and such attributes may not be present or may not sufficiently identify the elements participating in the Clash.
In this case, it is advisable to identify parameters that by their nature could identify the element in a precise manner (e.g., guid, unique id, ID codes, etc.).
Clash export configuration.
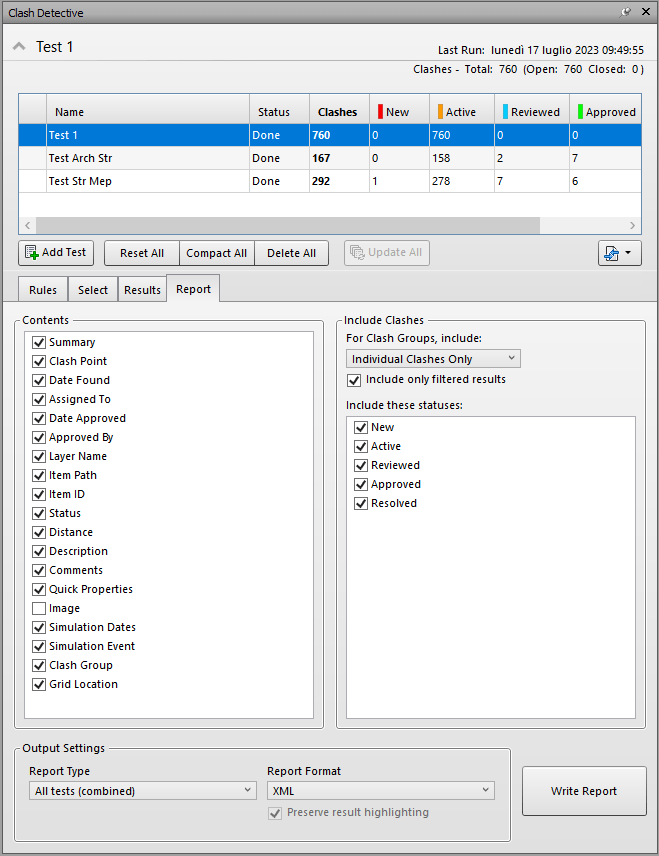
Configuring clash export is a critical activity to properly set up the data transfer from Navisworks to the Power BI report. In Navisworks, through the main Clash Detective window, you will be able to choose a number of options that will be described below and that will determine the format of the exported xml file.
Preliminary Check
It is recommended to pay close attention to the data export and selection phase, as it is quite easy to work with incorrect or outdated data.
Because of the way Navisworks is structured and the sharing tools made available, you may find yourself it can easily happen to work with an incorrect version of the model or with out-of-date Clash data.
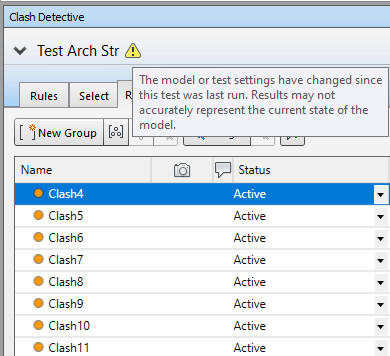
The same can happen when it comes to importing the model and Clash data from Navisworks into Vcad, where, for example, it is possible to import a version of the model that is not aligned with the current one, or to use Xml file data that is either out of date or linked to a different version of the model than the one imported. In some cases it is Navisworks itself that alerts us, in case there is a change in the model or test settings, of possible misaligned data.
Report Tab Configuration in the Clash Window
For proper export of the Xml file, you need to consider the options available in the Report Tab.
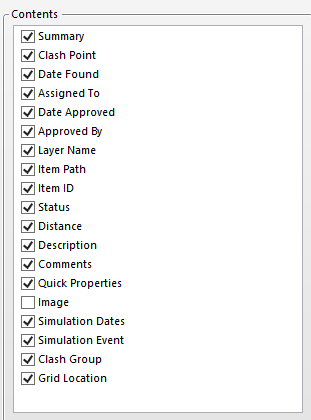
In the contents panel, you can select the fields that will be exported and then used in the report. For the purpose of using the Xml file to feed the Power BI report, it is possible to select all available fields (if not used for other purposes, it is recommended not to select Image as it will be ignored by the Power BI report).
Of particular importance are the fields:
- Clash Point, represents the location of the clash in the model, the coordinates will be used by Vcad to draw the clash marker
- Item Path, represents the clash item path and will be used by the report to draw the item tree
- Quick Properties, are the set of attributes of the clash item that you decided to export, acting on the Interface/Quick Properties/Definitions configuration described above
- Clash Group, group to which the clash belongs, will be used by the report to group individual clashes
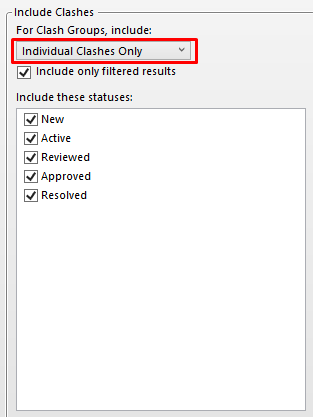
Include Clashes panel, it is important that the ‘For Clash Groups, include’ combo box is set to the value “Individual Clashes Only.”
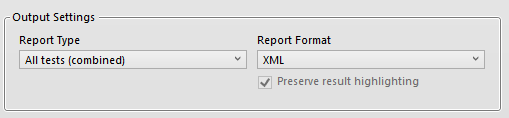
Output Settings panel, under Report Type you can select Current Test , All Tests (combined), All Tests (separate). The Power BI report import procedure accepts both single test and All tests (combined) export.
It is also possible to import the individual tests exported with All tests (separated).
The value of Report Format will need to be Xml.
Clash Detective Power BI Report
The following is a description of how to use the Power BI Report related to Navisworks’ Cash Detective.
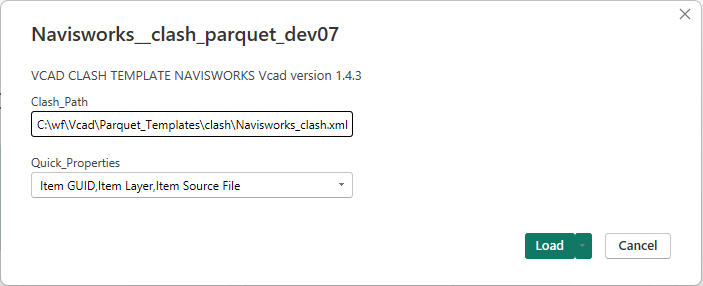
Template Parameters, two parameters will be requested when opening the report:
Clash_Path: is the local path to the Xml file containing the Navisworks Clash extraction
Quick_Properties: is the comma-separated list of Quick Properties used to export the Clash file. The default values presented by the template are: Item Guid, Item Layer, Item Source File
As written earlier, the choice of Quick Properties during the export phase of the Xml file is important in order to correctly match the clash and graphical elements of the model. Similarly, it is important to make sure that the names of the Quick Properties given in the parameter match those used during the export phase.
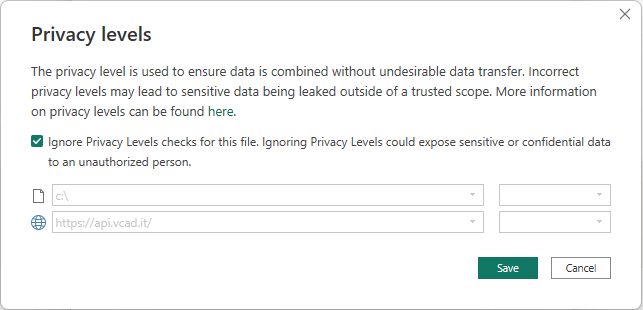
Note: A warning message about Privacy Levels may appear during the import phase, due to the fact that you are using a local data source (the clash xml file) and an http data (the Vcad extraction). You need to check the box and click the Save button to move on.
Structure of the report
At the top of the report we find the search panel which consists of:
– Tests, a list of tests exported from Navisworks. The field is single-choice, so you will only be able to select one test at a time, just as happens in the Navisworks Clash Detection window
– Clash Attributes: Clash Group, Clash Name, Clash Status, Assigned To, Approved By. These are all multiple selection fields
– Found and Approved Date: are the clash creation and approval dates, respectively.
Warning: selecting a Test other than the current one does not clean up the slicers. In particular, date slicers must be cleaned manually using the icon in the upper right corner of the slicer.
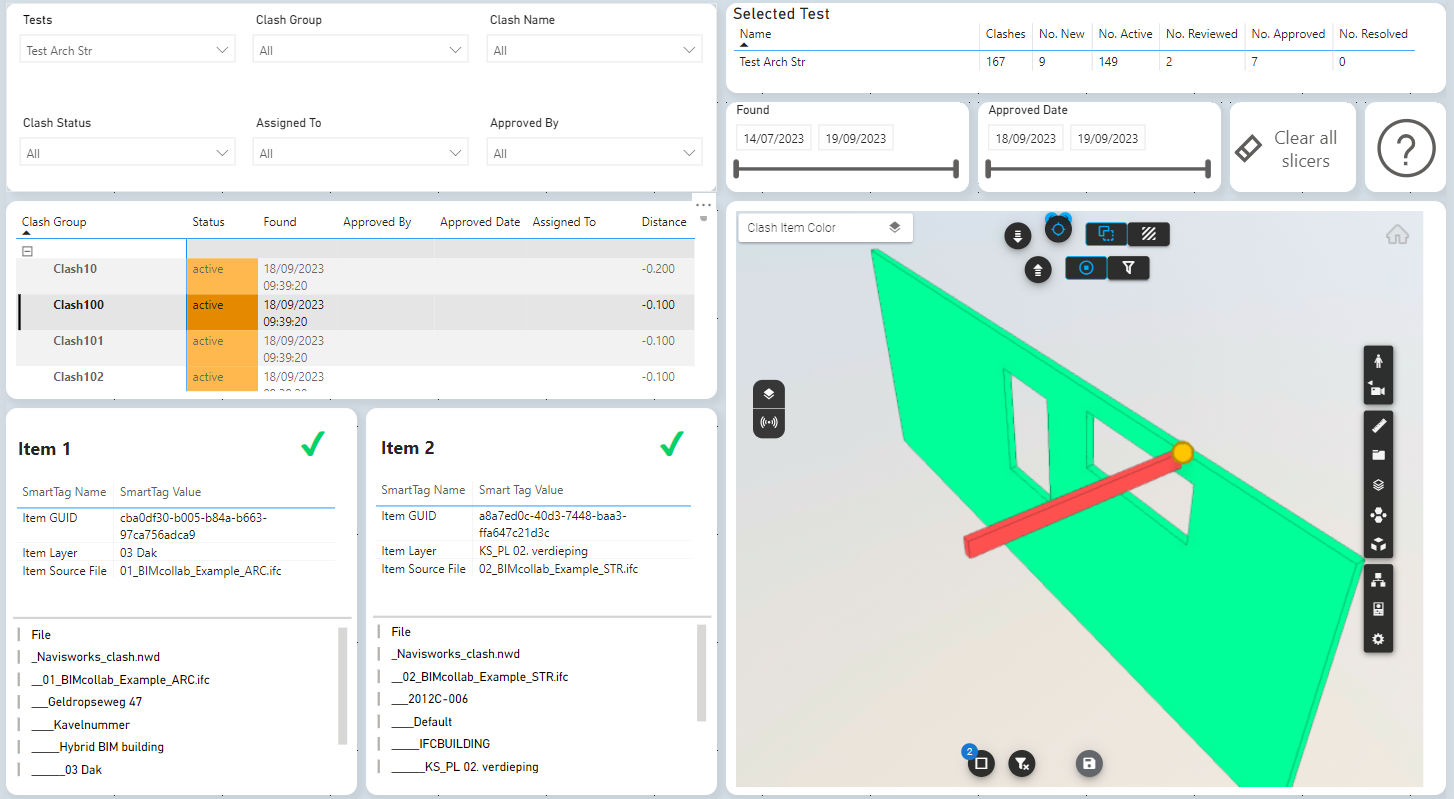
In the upper right corner is the ‘Clear All Slicer’ button that cleans all filter fields. The middle list represents the list of Clash grouped by group (if any). The status is highlighted with a color just as it is in Navisworks.
It is possible to select one or more Clashes using filters or by selecting rows in the table with the Ctrl key, as is normally done in Power BI. The selected elements will be displayed and colored in the viewer on the right, the clash point being represented by a marker. The color type of the elements can be selected from the theme combo box (top left) and you can choose between the classic clash item color (green and red) or the status color (active=orange,green=approved,etc.). The marker color will always be represented by the clash status.
At the bottom of the report are two panes representing Item 1 and Item 2 of the selected Clash.
Note: The information in the panes is consistent when a single Clash is selected.
The panes reproduce the information that is represented in the equivalent Navisworks Clash mask where the Quick Properties of the item and the tree structure that locates the item within the model are displayed.
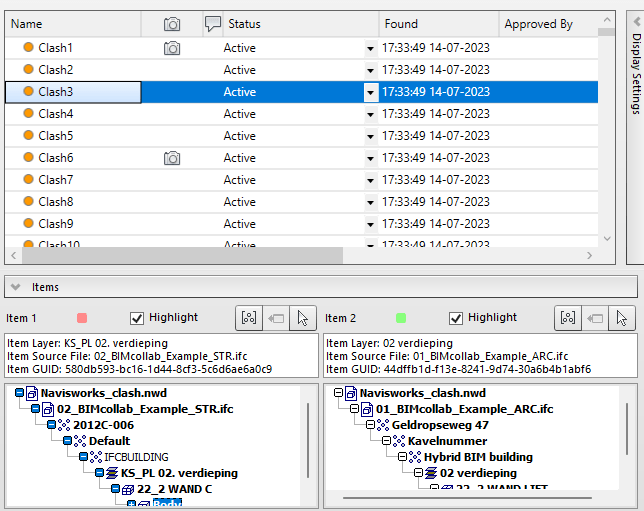
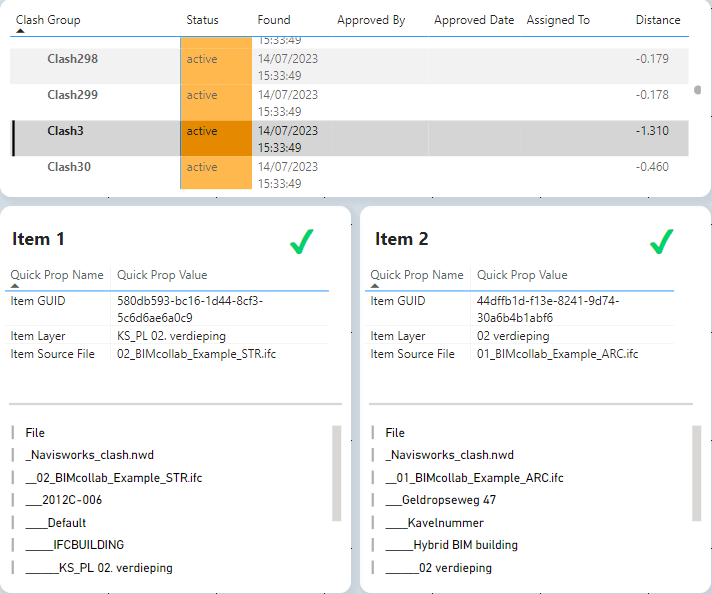
The icon to the right of the elements is important to know the association status of the graphical elements and data in the model with those imported from the Navisworks Clash Xml file.
The Green check indicates that the association has occurred correctly and that we have a unique association between the model element and the Clash data.
The Orange exclamation mark indicates that for the indicated Quick Properties there are multiple elements that match and therefore it is not possible to identify a unique element that matches the Clash item.
This often depends on the structure of the Navisworks model, where there are identical items repeated in the same layer.
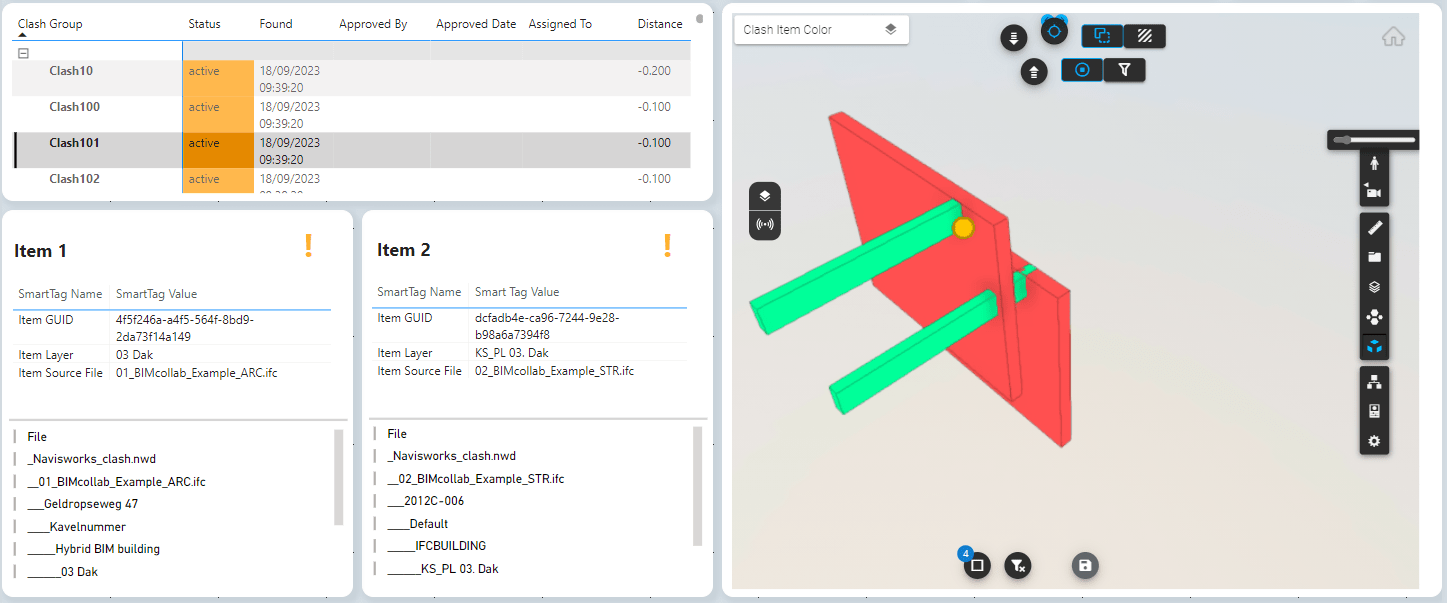
The image shows the case of multiple items associated with the same item, as you can see the icon indicates the anomaly. In fact there are 4 elements present for the two items. Note that it is possible to identify the correct items thanks to the position of the marker that represents the true point of intersection between the items.
The last case of anomaly is represented by a Red X and occurs when no geometric element present in the model could be associated with the when described in the Clash Xml. This can occur for various reasons, such as when the Quick Properties indicated in the template are different from those chosen when exporting the Xml file from Navisworks. The same thing can happen when using an Xml file that is out of date or otherwise not aligned with the version of the Navisworks template imported into Vcad.
* You can use this template with files imported in Vcad after October 1st 2023.