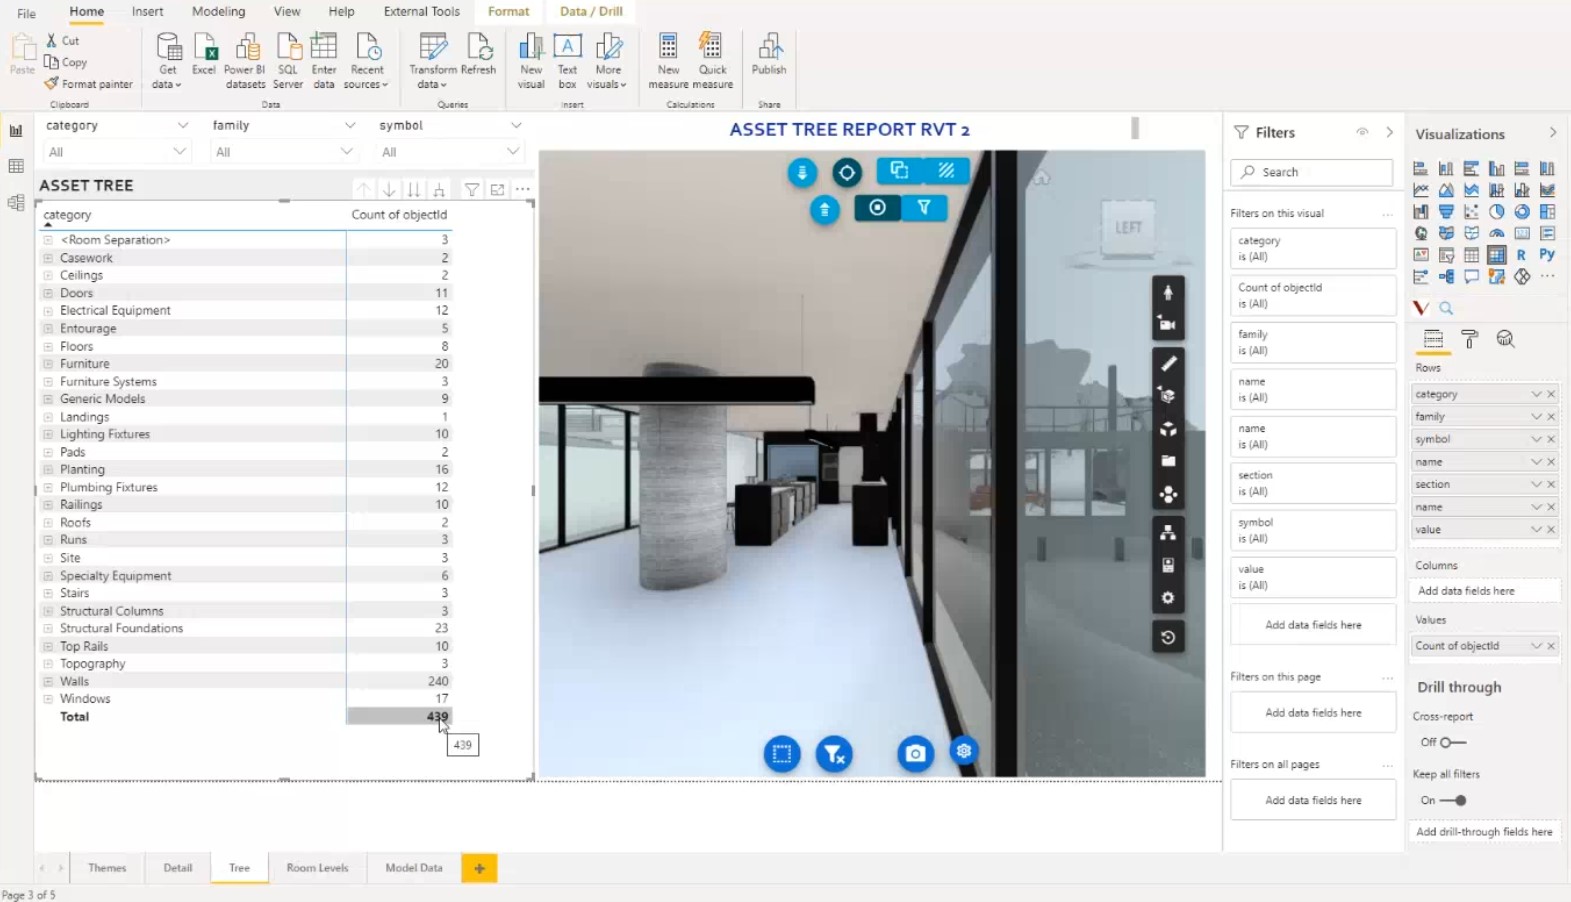
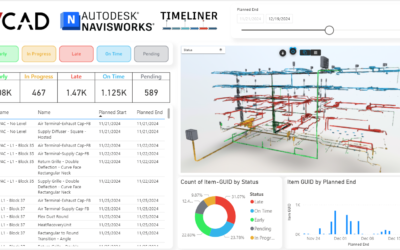
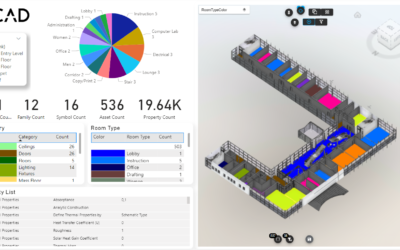
People have been asking us how they can show different Revit® views in their Power BI reports.
With Vcad it is easy to create a Power BI report with data coming from a specific Revit® view. These reports will only contain the data coming from the selected view/sheet.
With this feature you can decide how you want to present your data and model in the reports, allowing you to create drastically different reports based on the same model, and really help focus the report user on specific elements of the model.
Let’s have a look at how to use this new feature.
1. Publish the Revit® views
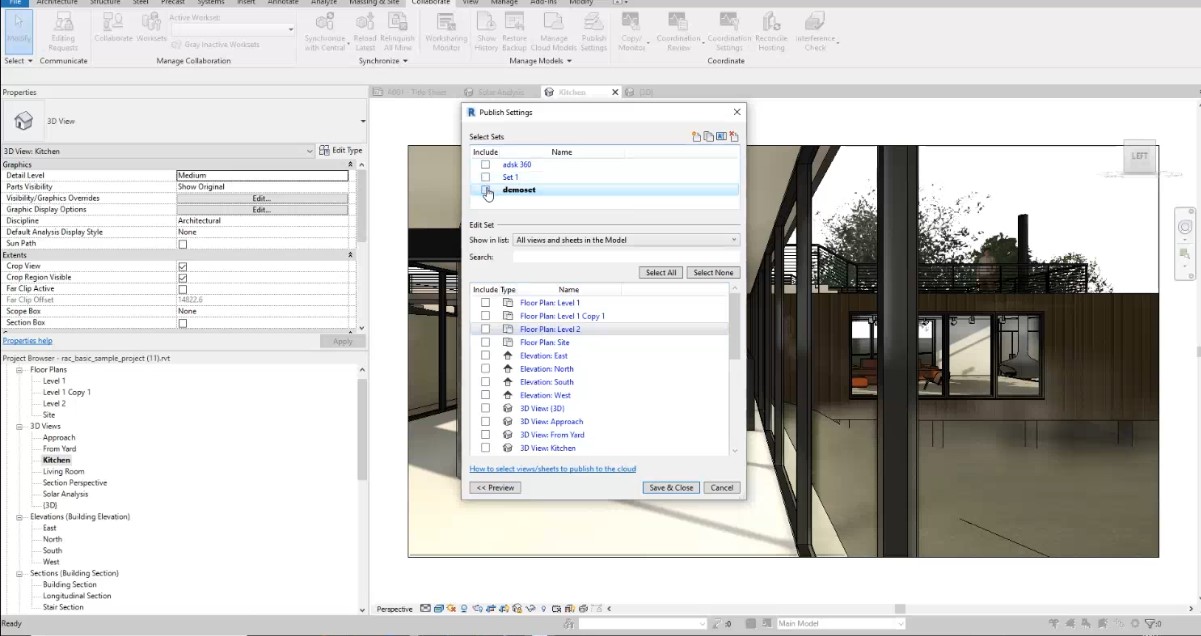
To be able to use a specific view in our report, you first have to publish it to the cloud from within Revit®.
For details on this operation, you can check out the official guide by Autodesk.
2. Import the file intoVcad
Now you need to import the Revit® file into Vcad.
Vcad will be able to extract the data coming from all the published views and sheets.
3. Select the view for the report
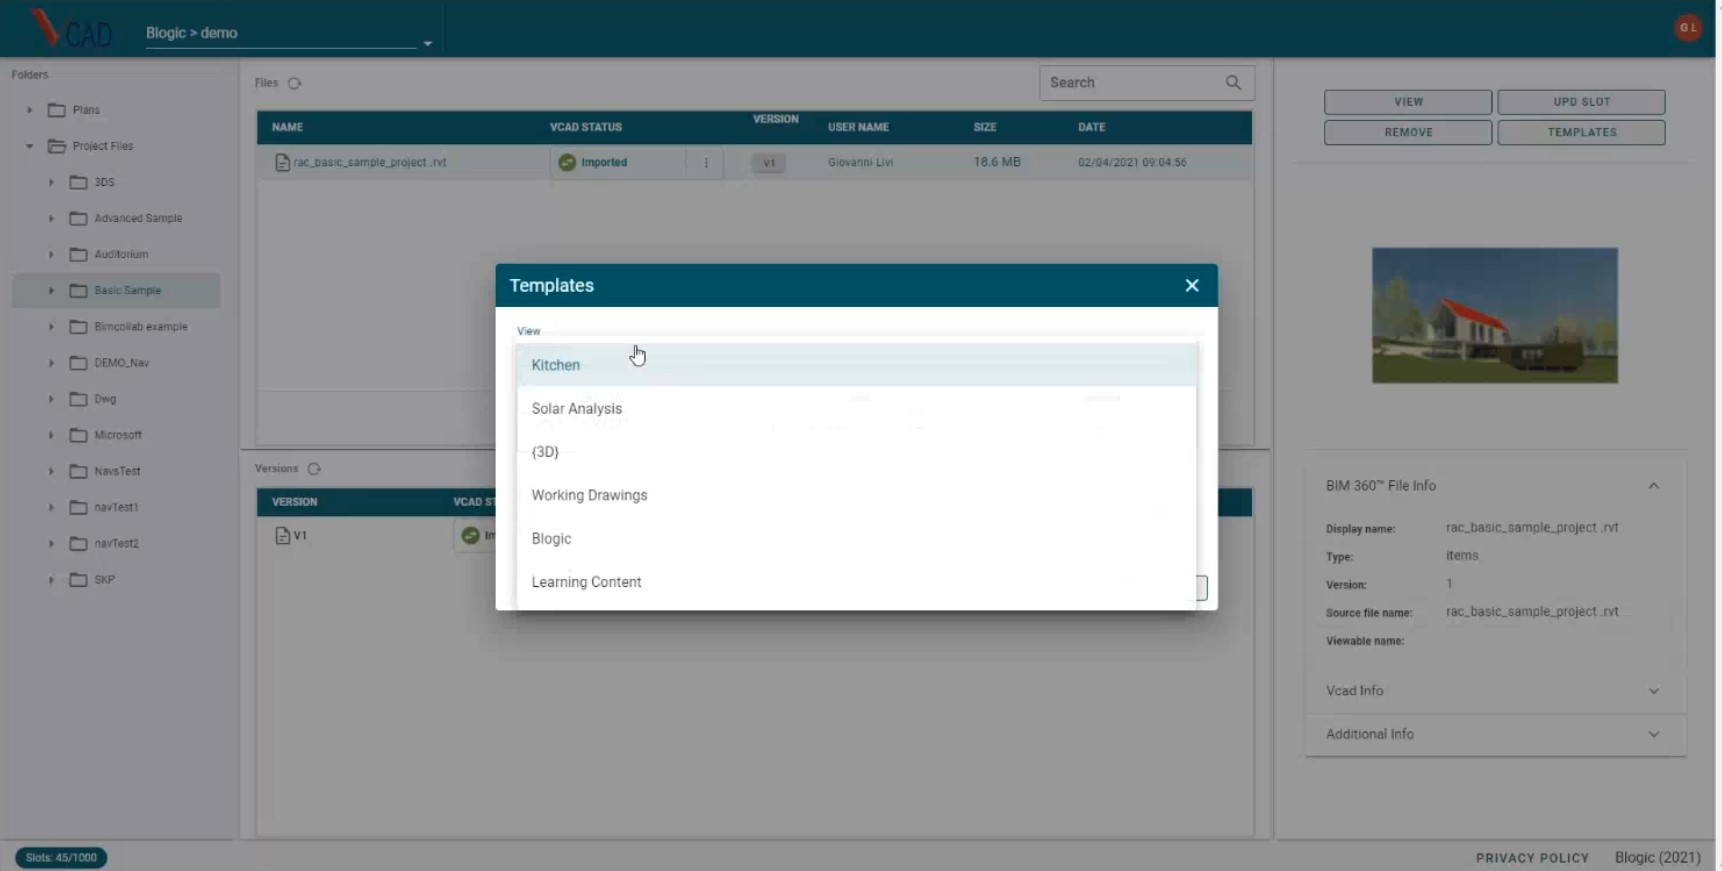
To generate a Power BI report template with data coming from a specific view you follow the usual procedure for downloading a template.
When prompted, use the dropdown window to select one of the views or sheets you have previously published. Finally download the report template with all the data of the selected Revit® view.
More information
If you want more information on how to setup you report with data from different Revit® views, check out our latest video.
Stay tuned for further posts describing how to select a different view or sheets from within an existing report.

