This article is part six in a series of articles in which we explore the creation of IoT reports using Microsoft Fabric and Vcad. Previous articles can be found here:
REAL-TIME IOT DATA, MICROSOFT FABRIC AND VCAD
REAL-TIME IOT DATA, MICROSOFT FABRIC AND VCAD #2
REAL-TIME IOT DATA, MICROSOFT FABRIC AND VCAD #3
REAL-TIME IOT DATA, MICROSOFT FABRIC AND VCAD #4
REAL-TIME IOT DATA, MICROSOFT FABRIC AND VCAD #5
This article describes the functioning of a Power BI report connected to devices installed in an apartment.
In this example we are using a BIM model that does not contain geometries regarding the devices. Therefore, we use other geometric elements, in this case the rooms, to link the devices. The report allows us to monitor the status of the devices in different configurations. Updating the report, at regular intervals, allows us to review changes in status and the historical trend of the devices through icons and graphs.
The Vcad custom viewer displays real-time data sourced as described in the previous articles of this series.
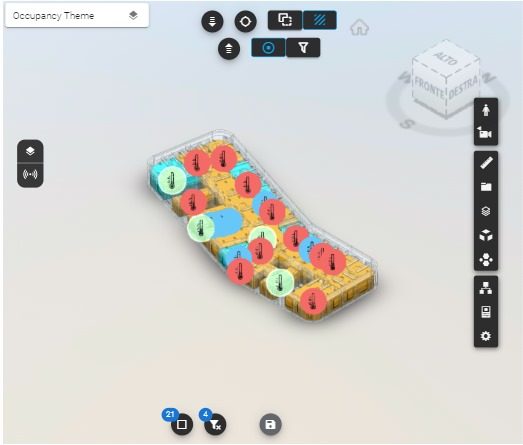 Figure 1 – Vcad custom visual
In the report, the room color is correlated with its occupancy level, which is measured by an occupancy sensor. The color of the corresponding custom icon represents a graphical representation of the temperature measured by the respective sensor.
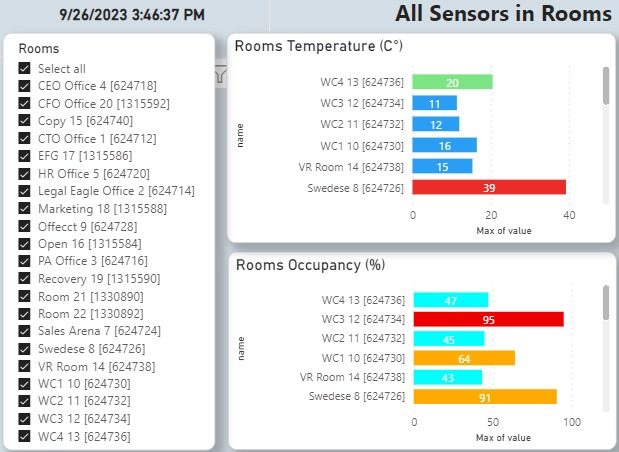 Figure 2 – Room and sensors selection
The graphs on the left side of the main image of the article allow you to select one or more rooms, or a specific sensor, whose data will be shown respectively in the VCAD viewer (real-time data) and in the underlying tables containing historical data.
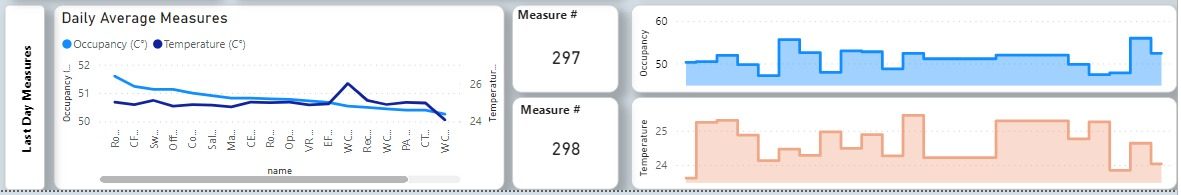 Figure 3 – Daily historical data
In the lower part of the report, the historical measurements from each sensor for the last day are displayed. The left-hand graph illustrates the average measurements across all devices, while the graphs on the right showcase the trends in parameter measurements throughout the day.
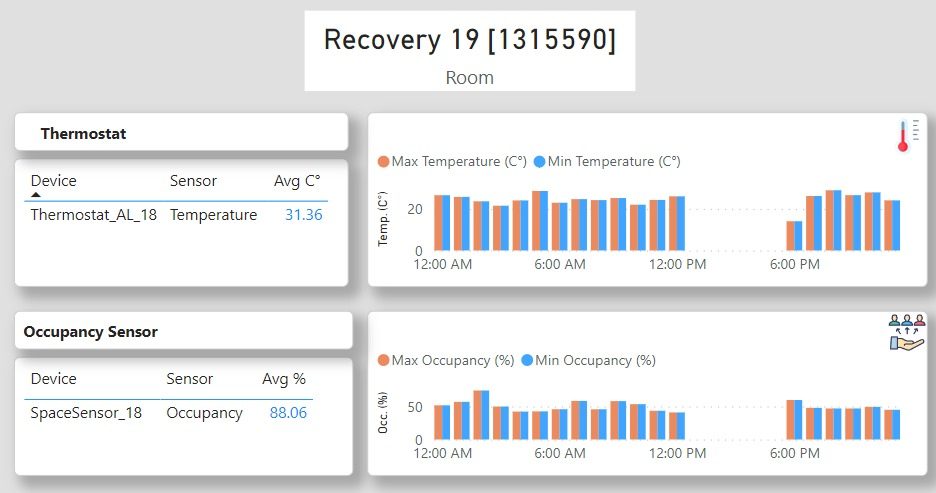 Figure 4 – Room tooltip
When hovering the mouse cursor over one of the rooms, a descriptive tooltip is displayed. This tooltip provides information such as the room name, the sensors’ name, and real-time data from the sensors.
Additionally, it also presents historical measurements for those particular sensors. This feature enhances the user experience by offering instant access to relevant information about the sensors and their data without the need for further interaction.
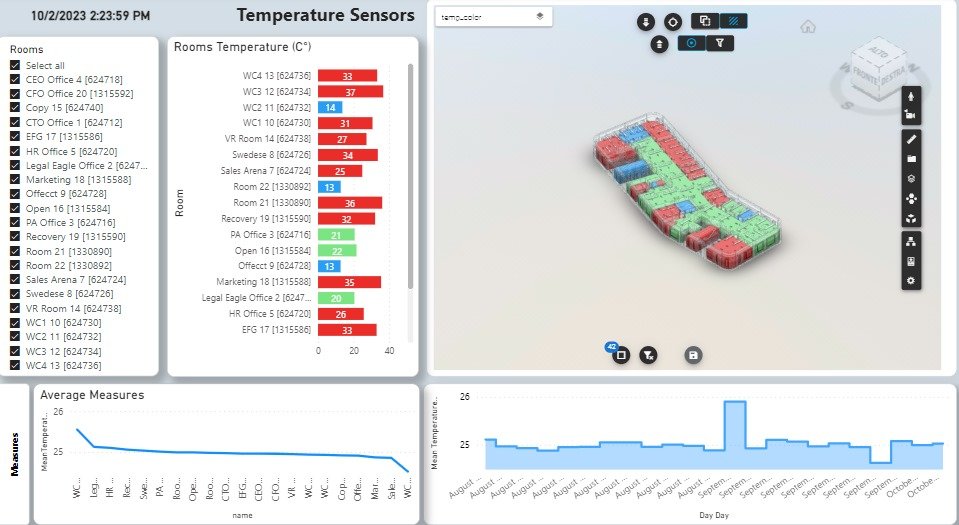 Figure 5 – Temperature sensors
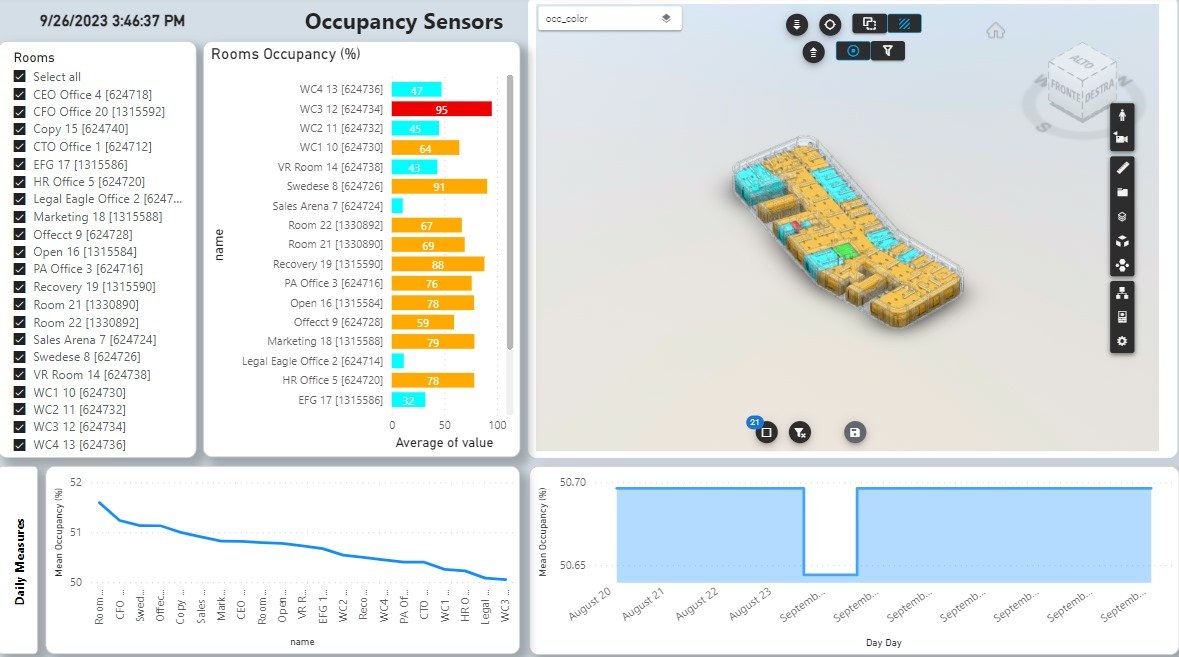
Figure 6 – Occupancy sensors
The other two pages of the report are each dedicated to a specific type of sensor: one for temperature and the other for occupancy. On these pages, similar information is graphically represented, mirroring the details provided on the previously described page. In these tow cases, real-time data is represented by the room’s colors, without using custom icons.
For instance, on the occupancy sensor page, you’ll find visual representations and insights related to occupancy levels in various rooms. Meanwhile, on the temperature sensor page, graphical data and trends pertaining to temperature measurements are displayed. These separate sections cater to the specific needs and interests of users, allowing them to delve into the details of occupancy and temperature data as required.
Conclusions
In this article we saw how Vcad can help us create IoT dashboards to review and communicate complex sensor data and trends leveraging our BIM models, even when the BIM files do not contain our IoT devices.
With other tools, highlighting and isolating rooms would otherwise require time-consuming adjustments, while Vcad makes the process of creating this type of report semi-automatic, fast and easy allowing you to spend more time with your data rather than worrying about BIM model refactoring and rendering.