This article describes the functioning of a report in Power Bi connected to devices present in an apartment. The report allows you to monitor the status of the devices in different configurations. Updating the report, at regular intervals, allows you to view changes in status and the historical trend of the devices through icons and graphs.
Basically, this is the end result of the study addressed in the following articles:
REAL-TIME IOT DATA, MICROSOFT FABRIC AND VCAD
REAL-TIME IOT DATA, MICROSOFT FABRIC AND VCAD #2
REAL-TIME IOT DATA, MICROSOFT FABRIC AND VCAD #3
REAL-TIME IOT DATA, MICROSOFT FABRIC AND VCAD #5
REAL-TIME IOT DATA, MICROSOFT FABRIC AND VCAD #6
The role of Vcad
The use of Vcad in the IoT report under study is crucial in many ways.
First of all because the main function of Vcad is to provide a direct link between data and the visual element which in the IoT environment provides an important plus in itself. Thus, for the tight integration that Vcad has with the Data Visualization extension of Autodesk Platform Services. Finally, due to the fact that using Vcad avoids the creation of specific monitoring software, as it is adaptable to any IoT data source, and to create a functional solution without having specific programming knowledge.
Both in combination with Power BI and without.
Implementation
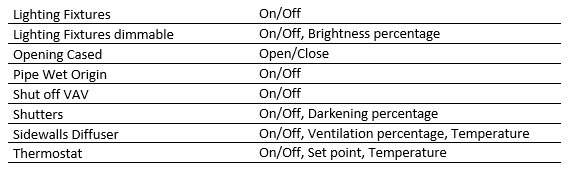
Each device includes one or more sensors.
Below is the table showing the types of devices with associated sensors.
Report structure
The report consists of 5 pages, each of which includes a Vcad viewer.
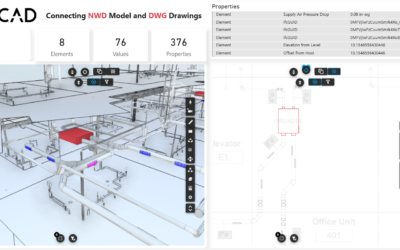
The icons, identifying model elements connected to IoT data sources, are configurable in Vcad at the user’s convenience and change according to their status. The use of icons is made possible by the Data Visualization extension of Autodesk Platform Services, which is integrated into Vcad. Vcad provides a simple and intuitive iterface for configuring icons.
![]()
The other visuals show sensor data and states according to the type of sensor.
Each icon is associated with a tooltip, visible on mouseover, which allows the user to view data and status of the last update and history over a defined time frame.
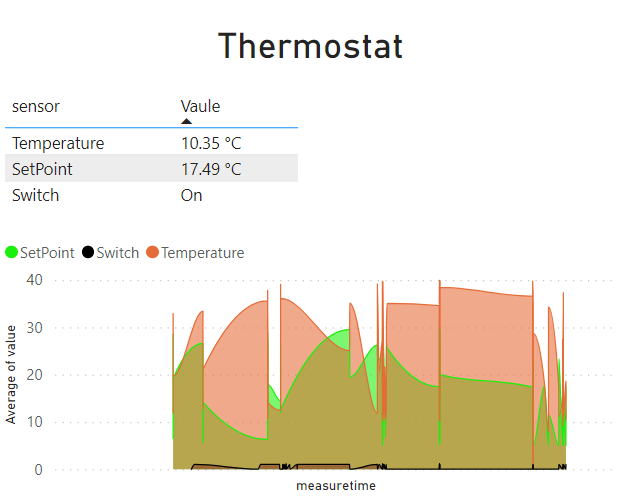 Figure 1 Tooltip on Thermostat
IoT devices
This page shows all monitored devices. The tabular part includes the list of types, the list of all devices, the list of sensors, the list of all devices that have an on/off sensor with the relative status. The selection on the checkboxes applies the filter to the other tables and to the model on the Vcad viewer.
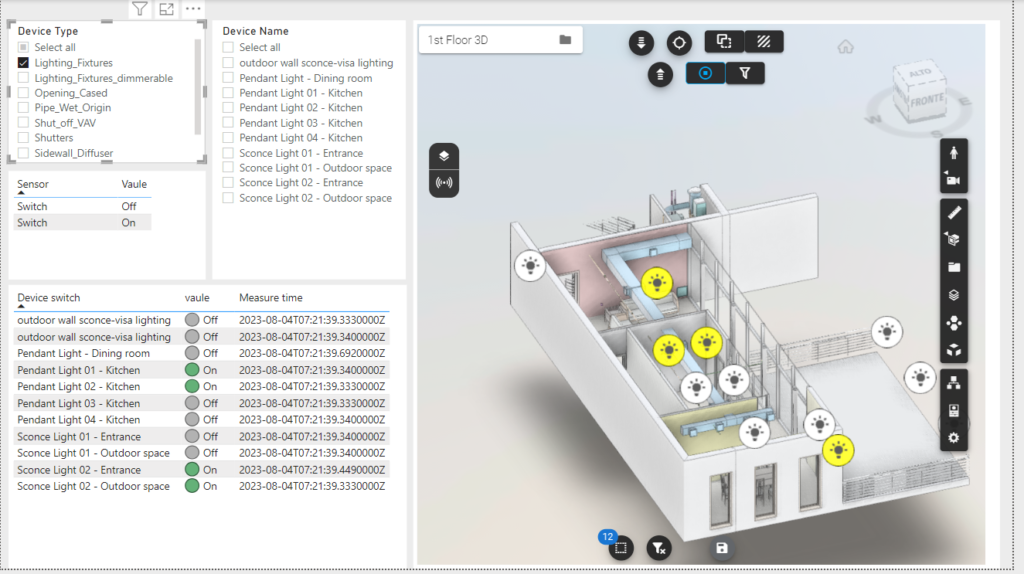
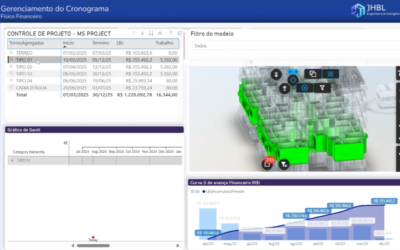
Figure 2 “Device IoT” page with “Lighting Fixtures” filter applied
Home dashboard
Represents the control panel for all devices. It allows you to view the current status at a glance. The monitored devices are dimmable and non-dimmable lights, shutters, thermostat, and front door.
• Non-dimmable lights: on/off status.
• Dimmable lights: brightness percentage set.
• Shutters: opening percentage.
• Thermostat: on/off status, set point, temperature measured.
• Front door: open/closed status and last access timestamp.
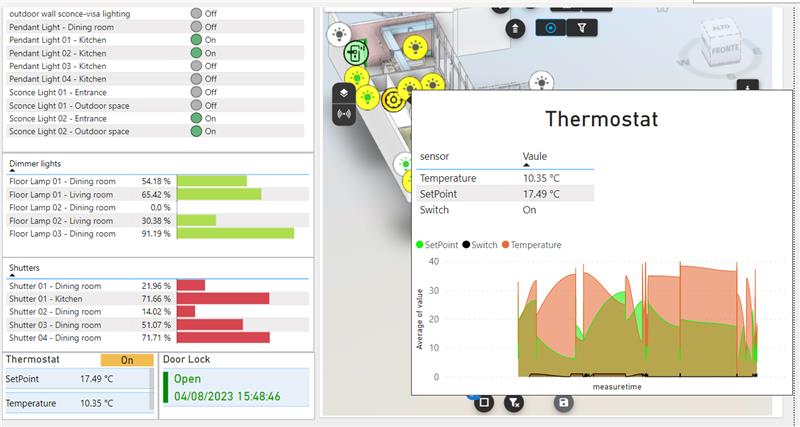
Figure 3 Page “Home Dashboard”
Lighting
Shows the status of all the lights in the apartment. A table displays the on/off status of all the lights, a second table displays, with a bar graph, the brightness percentage set for the dimmable lights.
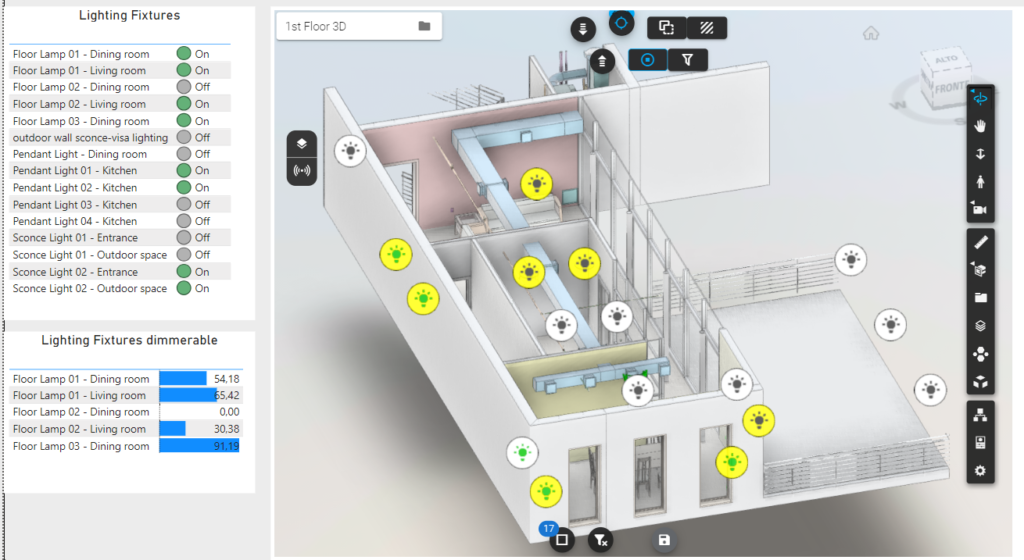
Figure 4 “Lighting” page. In the model, the lights on are those with a yellow background, the lights off are those with a white background
Climate control system
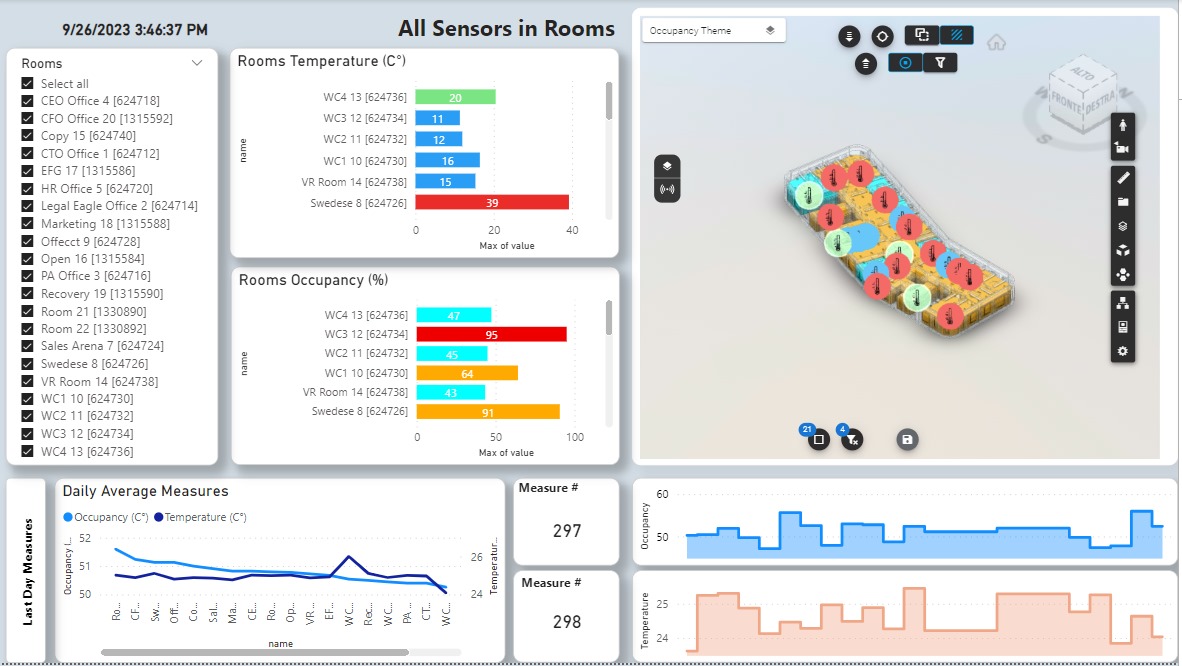
Shows the status of the air conditioning system. One table displays the on/off status of each device, while another table displays the logged temperature. A line graph at the bottom of the page displays the history of the average temperature recorded by all sensors.
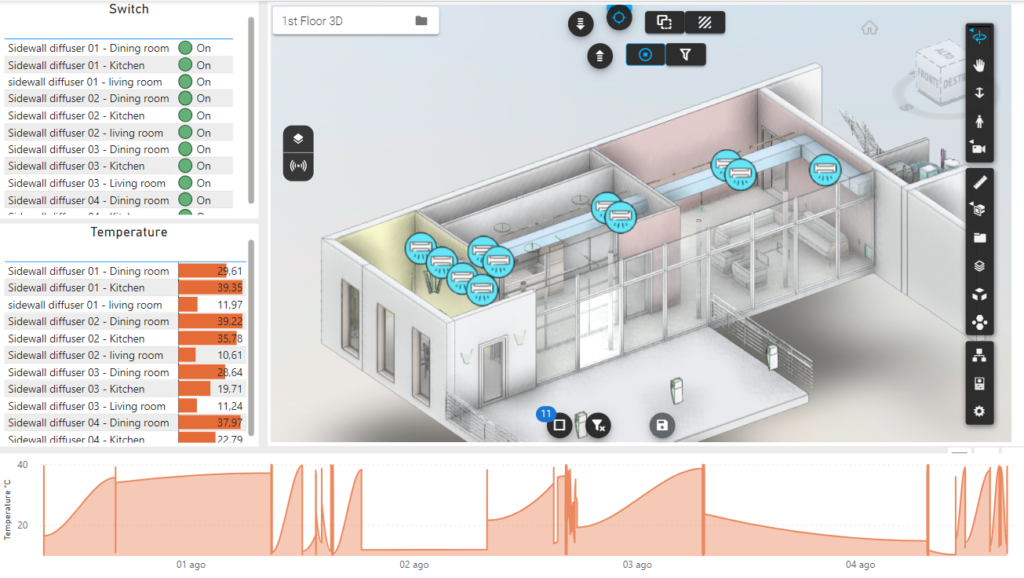 Figure 5 “Climate control system” page in which all the diffusers are working
Shutters
Shows the status of the shutters, if open or closed and the percentage of obscuration.
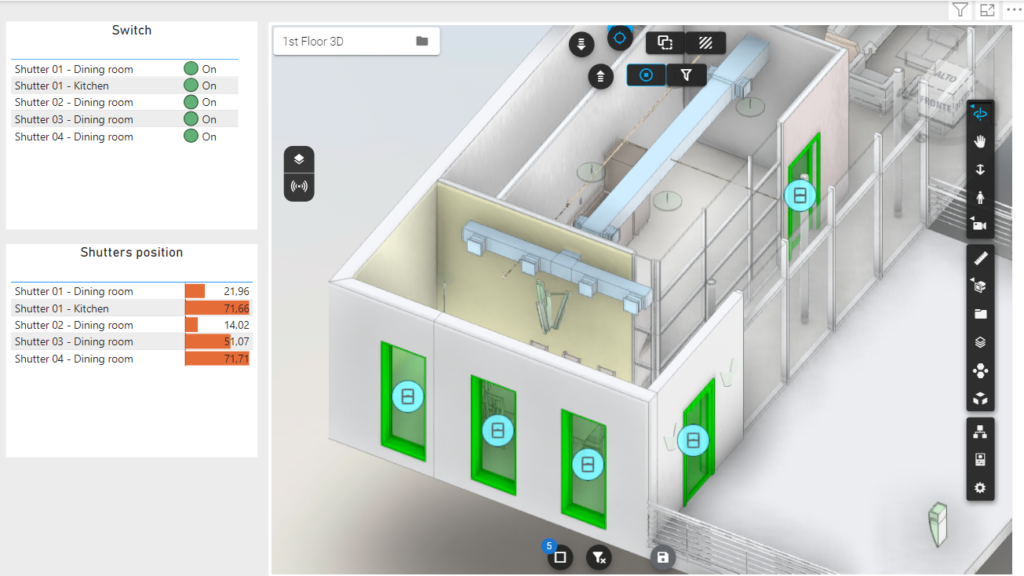
Figure 6 “Shutters” page. In this case all the shutters are open. The shutter position table indicates the darkening percentage (100% corresponds to closed shutter)
Conclusions
In spite of the technology behind the collection and sending of IoT data, this study was conducted to show that the use of Vcad brings significant benefits.
One of these is undoubtedly the fact that the user does not have to worry about how to take advantage of and leverage the data collected. The Power BI Vcad combination is all that is needed. Without having any special programming knowledge, he has at his disposal a tool that allows him to shape the data as he wants, according to his needs and visually linked with the BIM model.
Second but not least is the savings in time and money. Once the data is collected, creating a report like this involves a few days of work, no specific and expensive software is needed, it can be shaped and edited as desired, and finally shared very easily.