It was designed to bind colors to both data in the model and external data.
How does it work
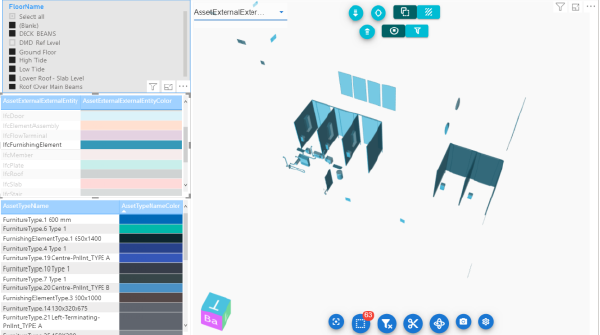
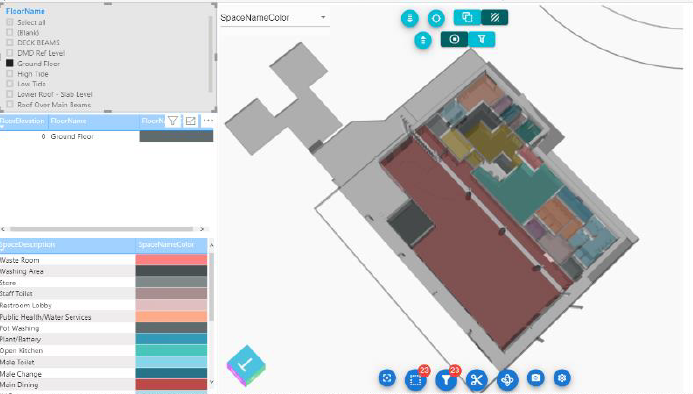
The report consists of two pages that display the colors of the spaces and those of the assets, respectively. The Report is divided into two sections, on the left the data part and on the right the view of the model.
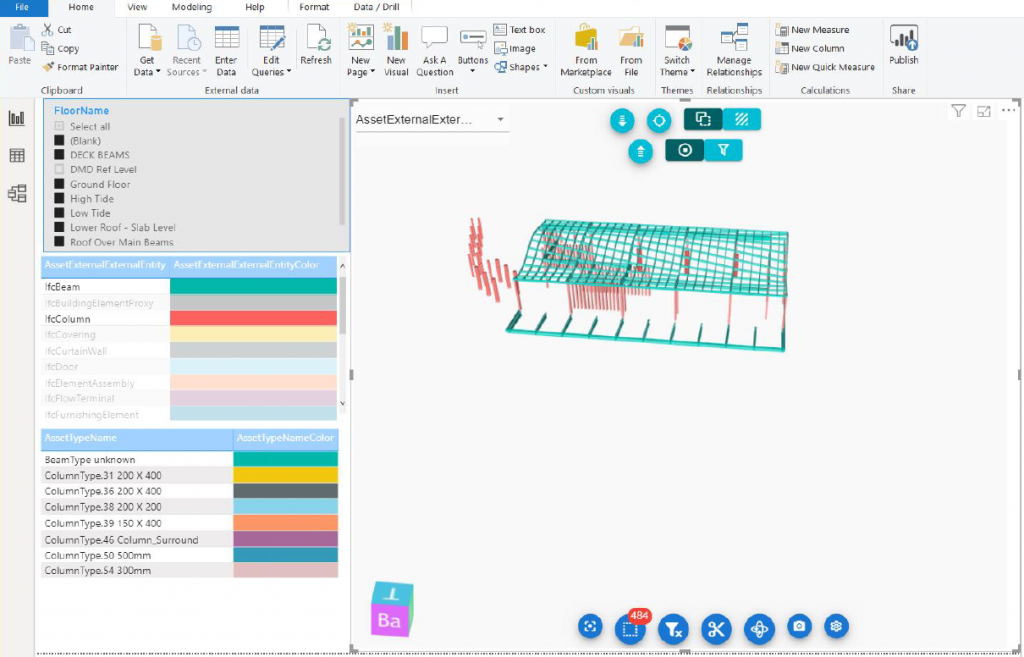
Data can be filtered by a slicer that contains the list of floors and determines its visibility.
The Assets example
Looking at the assets report we have an example of two levels of aggregation of data to each of which a color index has been assigned.
A first level is a color aggregation by entity type.
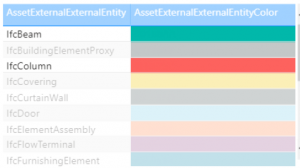
Another layer is an aggregation for the asset type name.
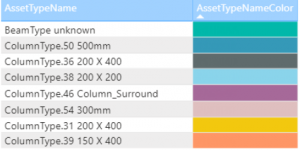
We can choose the aggregation color to be viewed using the combobox on the top left of the viewer.
For a better view of the parts of the model we are interested in, we can control the visibility (visible, hidden or x-ray) of all unselected items using the toolbar at the top.
Report Configuration
Configuring the Fields associated with the viewer determines the behavior and appearance of the selected items.
External ID:
Indicates the table field (e.g. Assets or Space) from which ExternaID will be indicated that will tie the data to the model element.
Floor External ID:
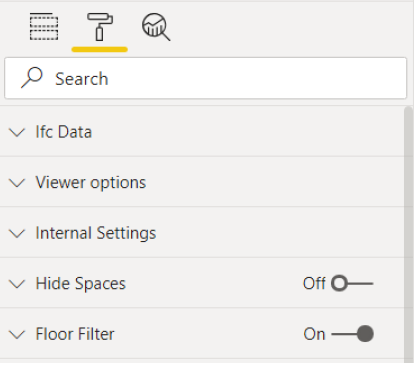
Represents the ExternalID of the floor that can be filtered by the FloorName slicer, to be used in conjunction with ‘FloorFilter – On’ in ‘Format’ section.
Highlight Color:
These are the fields from which the color is taken and that will appear in the viewer selection combobox.
Conclusion
In this post we looked at the Asset and space themes template, in particular the visuals it starts out.
For more information on the Asset and space themes template checkout the video below and come back soon for posts on the other templates available for download.