“QUANTITIES AND MATERIALS DASHBOARD“ webinar, October 11, 2022 at 4:00pm CET
During the webinar we will build a dashboard highlighting how to use quantity and materials data in a report.
We will see how Vcad makes it easy to take advantage of the information in BIM files, transform and associate it with model rendering.
ROOMS QUANTITIES
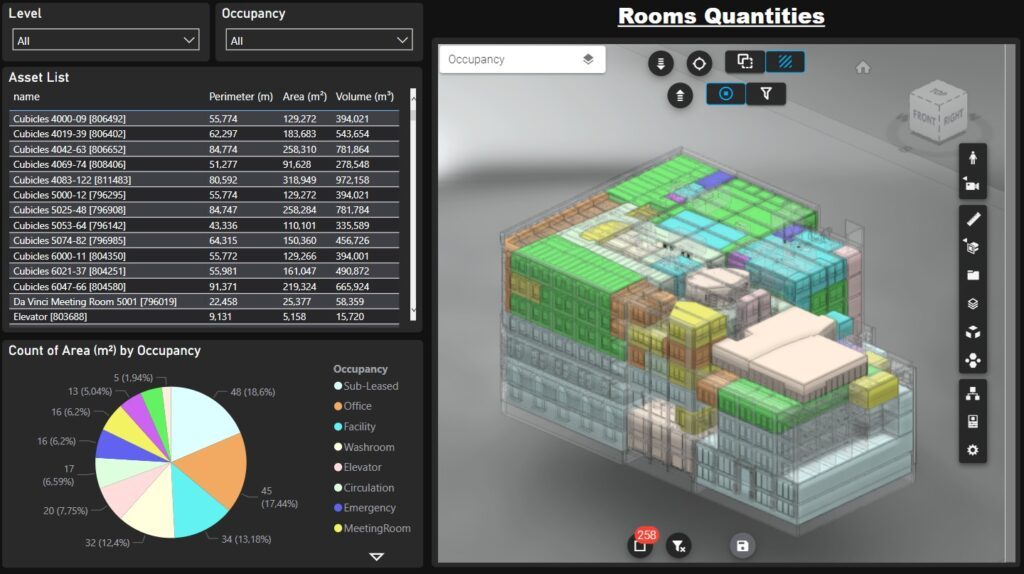
The first dashboard we will show focuses on the analysis of room quantities in a Revit model.
The report contains perimeter, area and volume values for each room in table form and more visually using a pie chart. It will also be possible to filter the building by levels.
MATERIALS DETAILS
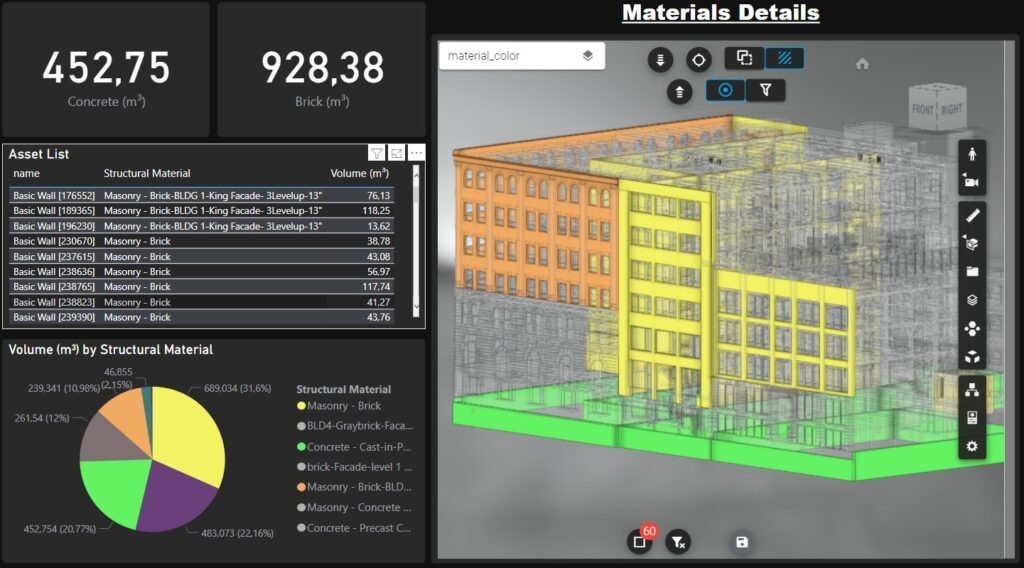
The other dashboard we will realise focuses on the analysis of materials in the same Revit model.
This report contains a comparison of the volumes of concrete and bricks in the building walls. The materials are highlighted in the model using a color theme.
If you cannot attend but still register, you will receive the webinar video the next day.
Blogic approval is required to participate in the webinar; registrations with obviously false data will not be accepted. Personal data collected will be used only for the purpose of webinar participation.