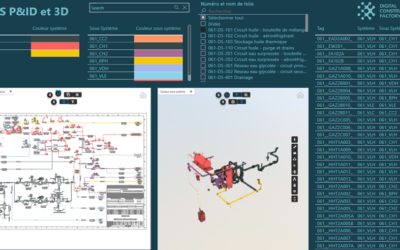
The case presented below represents a system for real-time monitoring of energy generated by solar panels and wind generators.
The project also includes a web dashboard for data presentation that is a sample replica of what was done for a large solar and wind farm in North America. Several reports were produced for the project, such as the one we will show, also for the analysis of historical data. The BIM file used in the example is Autodesk’s “Rac Basic Sample” in Revit format and the data are simulations but any real data stream is clearly usable.
Operational tools used
Vcad: BIM model visualization and use of markers as rapresentation of each sensor with tooltip on actual value.
Node-Red: generator simulation and data flow management.
InfluxDB: data stream persistence.
FlexDash: web dashboard that displays information in the form of widgets and integrated with the Vcad web component.
Structure of the generators
The BIM model contains wind generators and photovoltaic panels. Sensors are represented by markers and, thanks to Vcad’s API, sensor data is automatically linked to the corresponding geometries in the BIM model.
Wind generators
• Wind speed sensor in m/s. Range 0-20
• Energy sensor produced in kWh. Range 0-5
Photovoltaic panels
• Vertical inclination sensor (tilt) in degrees. Range 0-90
• Sensor orientation in degrees. Range 0-360
Data flow
The data used in the dashboard are read from an InfluxDB, a database built specifically for storing and retrieving time series instances, and piped in a stream to the dashboard output.
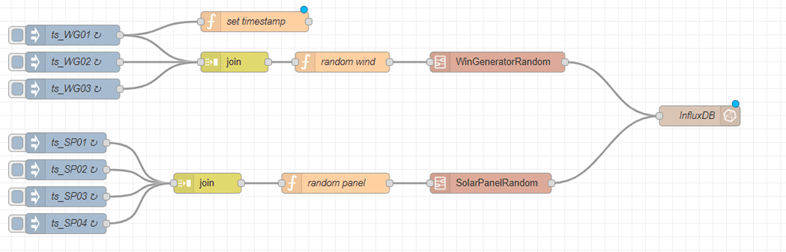 Figure 1 – InfluxDB powered by generator sensors.
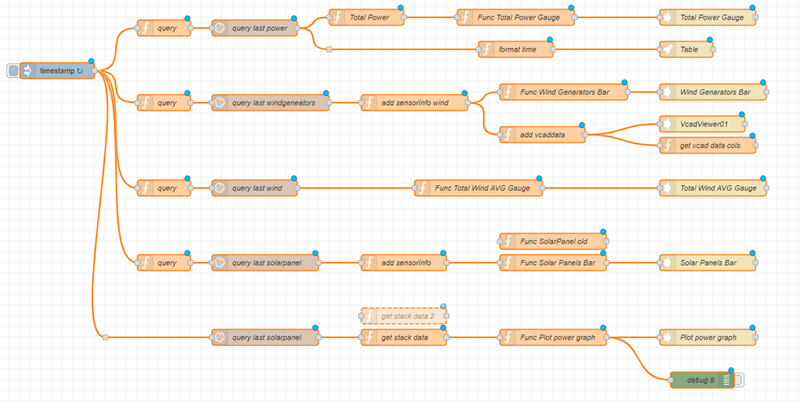 Figure 2 – Generator power supply.
Dashboard
The dashboard consists of a control panel for monitoring the parameters sent by the sensors in real time.
Vcad: Vcad viewer to represent the BIM model and sensors data through markers, tooltips and color themes.
Real Time Values: table showing the trend over time of the energy produced by the devices. It contains three fields: Time Stamp, Id and Value.
Wind Generator (histogram): real-time data for each wind generator. Wind speed in m/s and energy produced.
Solar Panels (histogram):real-time data for each solar panel on three different scales, panel tilt from 0 to 90 degrees, panel orientation with respect to north from 0 to 360 degrees, energy produced from 0 to 5 kWh marked by a linear graph.
Wind AVG (measuring instrument): real-time value of the average speed measured on all wind turbines.
Total Power (measuring instrument): real-time value of the total energy produced by all generators.
Time Plot (line graph): time trend of the energy produced by the two types of generators, wind turbines and photovoltaic panels.
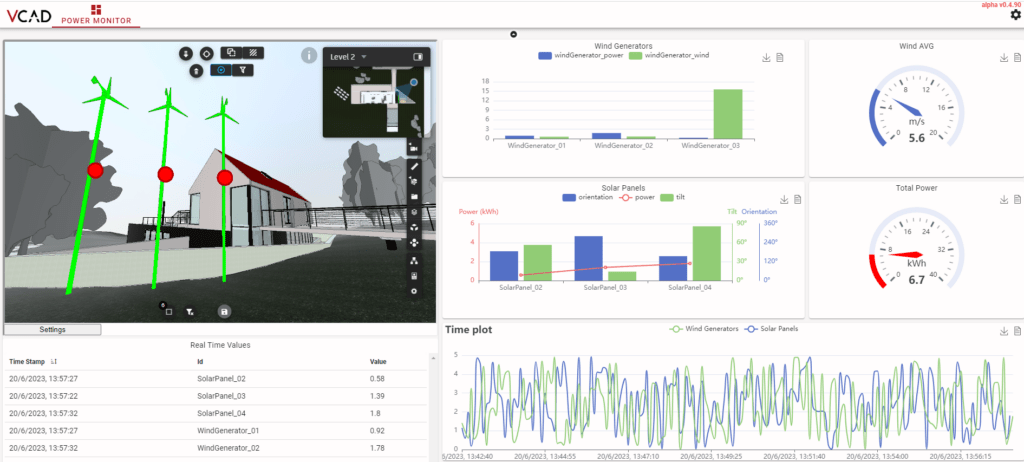
Figure 3 – The real-time dashboard
This use case demonstrates how easy it is to integrate Vcad into any web platform and have it work with real-time data as well. The combination with Node-Red enables the realization of particularly effective IoT dashboards thanks mainly to the direct data-model connection that Vcad provides.
Click here to see the dashboard in action and subscribe to our Youtube channel.