During facility maintenance emergencies it is critical that facility managers can quickly determine the reasons for the emergency and identify the building system(s) associated with or impacting the emergency, along with all related building data. Using Autodesk Navisworks, facility managers can utilize the ‘Find Item’ tool to select and isolate the building system associated or responsible for the emergency based on user-defined rules. To create these rules, facility managers need to be aware of the properties embedded in the Building Information Model and set up search rules in Navisworks to isolate and view systems independently from the entire model or within context of certain components of the model. Creating search rules every time an emergency maintenance occurs, creates a bottleneck towards faster and immediate response.
VCAD, through its Power BI templates, provides a faster, more efficient, and user-friendly way to isolate a building system during emergency maintenance using properties embedded in the BIM model. A case study was prepared to test the Power BI template generated through VCAD for Systems-centric Navigation during emergency maintenance. A Navisworks BIM model for an academic science and classroom building in Virginia USA was used for the case study development. The model was embedded with systems-centric parameters to facilitate systems-centric search and navigation in Power BI. Once data was populated, the Navisworks model file was first converted to an IFC file format using iConstruct and then used to generate a Power BI template file using VCAD
The Power BI template file for the case study was set up using Power BI visualization tools to allow for selection and isolation of building system elements based on the Systems-Centric parameters defined. A scenario was used to test Power BI’s utility during an emergency maintenance request. Figure 1. shows the Power BI dashboard setup to facilitate Systems-Centric navigation during the scenario. The following provides a detailed explanation of each marked section of the dashboard in Figure 1.
- Location Served: A text filter visualization tool was used to create three filters to allow users to type the location of an affected room and filter data regarding building systems serving the room. Depending on the building air system the user wants to isolate for the affected room, they can either fill LOCATION_SERVED_EXHAUST, LOCATION_SERVED_RETURN, or LOCATION_SERVED_SUPPLY.
- Multi-Level System Hierarchy: The Slicer visualization tool created a filter where users can select which building system they would like to isolate. Users can select multiple building systems to see how building systems are linked in the 3D model. The slicer follows a hierarchical structure starting with a broader understanding of the building system (Eg: Mechanical System or Plumbing System) to a much-detailed view of the building system (Eg: Chiller Supply System or Chiller Return System).
- Data Matrix: A matrix visualization tool has been used to display systems-centric parameters for the mechanical equipment present in the building. The data in this matrix can be filtered using the text filter/slicers present in the dashboard or by selecting an object in the 3D viewer.
- Equipment Served: Created using the slicer visualization tool. This tool will help users in isolating the building system based on the equipment these building systems serve.
- Floor: This slicer will assist users in isolating data based on the floor level.
- Zone: The building was divided into five zones based on the different mechanical systems implemented for cooling, heating and ventilation of the different spaces.. Using this visualization tool, users can isolate data based on the zones.
- Equipment Description: Using this filter, users can filter data related to equipment present in the building. The filter lists all the equipment present in the building users can select the equipment whose data they would like to see in the data matrix and 3D model.
- Forge Viewer: The 3D model of the Revit/IFC file uploaded to the VCAD website can be seen in the Forge Viewer. This viewer utilizes Autodesk Forge API to show the graphical data that was present in the uploaded file. This viewer is also linked to other filters and visualization tools present in the Power BI dashboard. Defined dashboard filters will also be applied to elements in the graphical viewer. Users can also select the element in the viewer to filter the data shown on the dashboard.
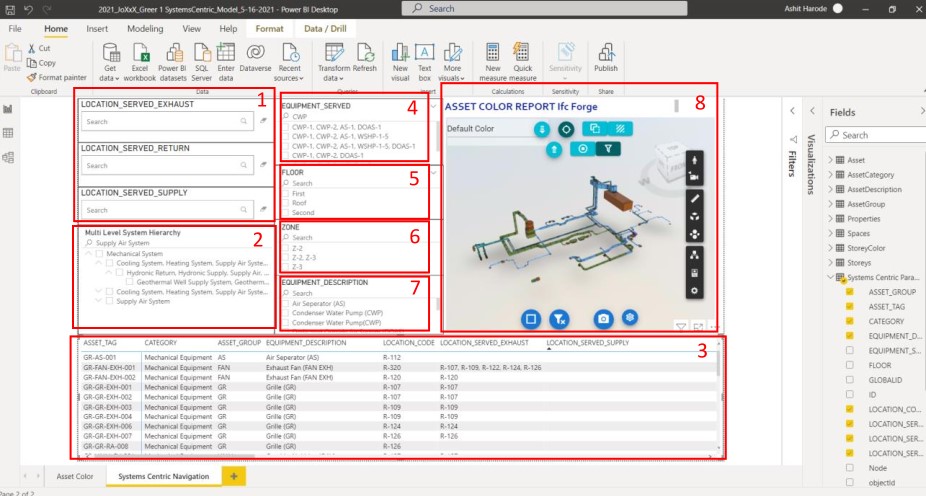
Figure 1. Power BI dashboard setup to facilitate Systems-Centric Navigation
-
Emergency Maintenance Scenario
During building operation, a facility staff was notified of poor air quality in a particular location in the building. This was considered an emergency since the building houses office spaces, labs, and classrooms and the poor air quality issue had to be resolved immediately. Poor air quality can be a result of problems in either the exhaust air system or the supply air system of the building. To perform an initial inspection of these air systems, facility staff can first isolate elements in the BIM model associated with both supply and return system elements serving the specific location. Using the Power BI dashboard shown in Figure 1, facility staff can isolate both these systems based on Systems-Centric Parameters and identify the location of the equipment.
Figure 2 shows how the Multi-Level System Hierarchy slicer in Power BI was used to isolate the elements belonging to Supply Air System were isolated. Data related to the mechanical equipment in the supply air system was also filtered to provide facility staff with the necessary information required for the initial inspection. Using the same slicer, facility staff can isolate the building’s exhaust air system and filter necessary information, as shown in Figure 3.
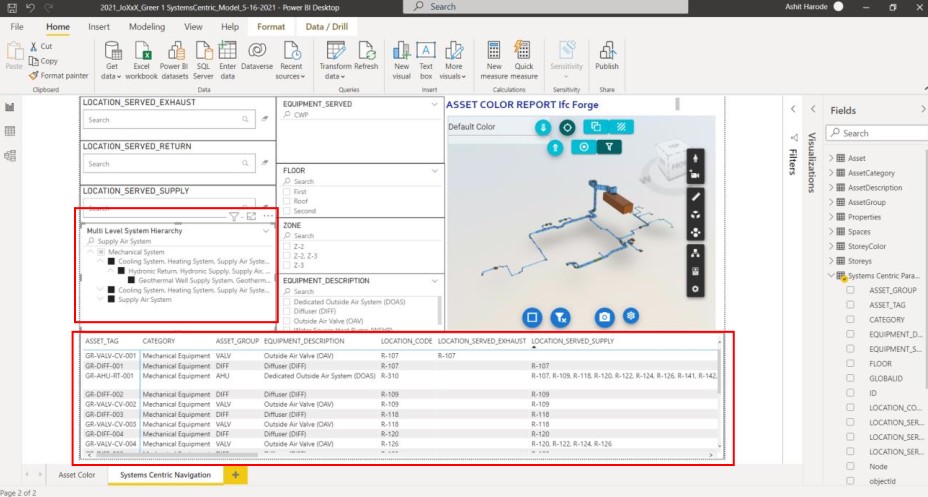
Figure 2. Supply Air System for the research building
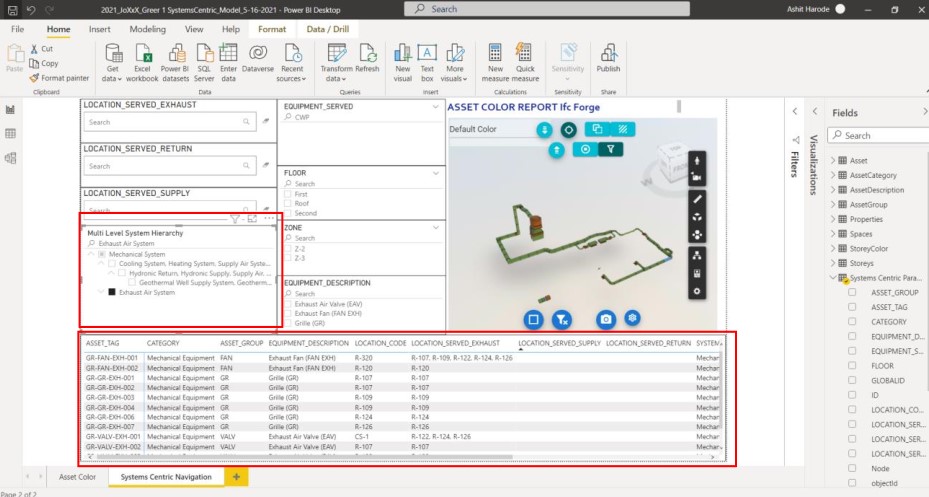
Figure 3. Exhaust Air System for the research building
Initial testing indicated that poor air quality was due to improper functioning of the Dedicated Outside Air System (DOAS). A work order for the repair of the DOAS was put in place. Before the DOAS could be repaired, it was advantageous and necessary to identify all systems and elements connected to the DOAS. To isolate these systems, facility staff can select equipment served as “Dedicated Outside Air System” and see the systems and elements connected to the DOAS in the 3D model viewer and the Multi-Level System Hierarchy list (Figure 4).
Facility staff can then select the systems connected to DOAS in the Multi-Level System Hierarchy list, filtering the information for equipment within these systems, as shown in Figure 5. Once the location of the equipment is identified, it can be used to disconnect the building system from the DOAS for the duration of the repair.
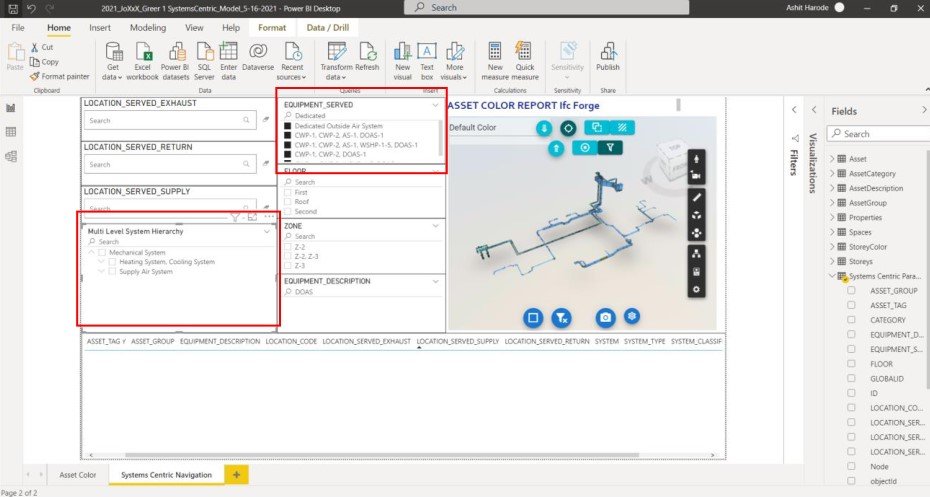
Figure 4. Systems connected to DOAS
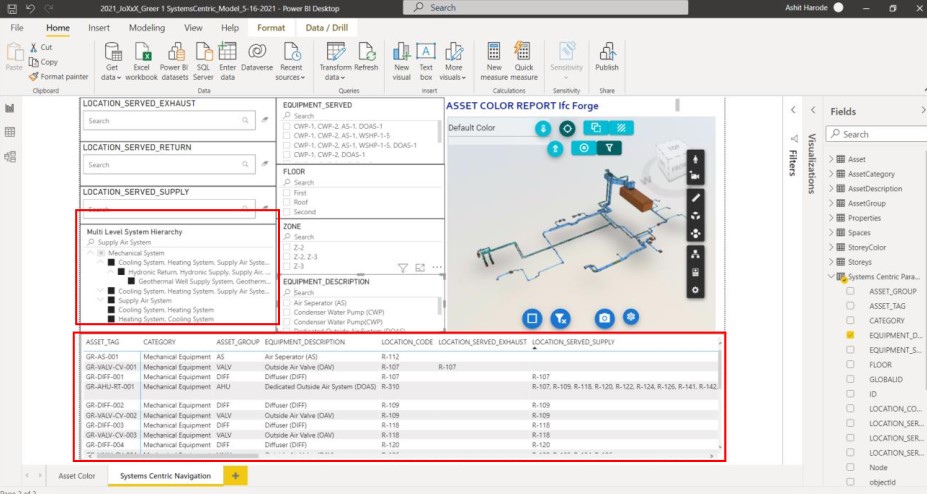
Figure 5. Equipment belonging to the systems connected to DOAS
The Power BI dashboard shown in this case study has been developed to assist facility managers in the research building. Power BI dashboard can be modified to serve the specific needs of owners and facility managers for different maintenance scenarios. The ease of use that comes with Power BI in visualizing and filtering data can help overcome the bottleneck of using Navisworks when responding to emergency maintenance requests.
Future Work Section:
As part of proposed future work, the authors would like to test the capabilities of the Power BI template generated through VCAD in integrating the IoT sensor data. Integrating this data into Power BI will allow for adding operational data to the Power BI template and perform analysis and forecasting using Power BI tools. This future research work will also focus on creating a higher-level digital twin using the Power BI template as a central location where static data from the BIM models and dynamic data from the sensors can be integrated.
The research team has generated this case study at The Virtual Facility Research Lab (VFRL) at Virginia Tech. The team consists of Ph.D. student Ashit Harode and Mahnaz Ensafi, and Dr. Walid Thabet