The use of Navisworks for facility management is restricted to facility managers with prior knowledge and experience with the software. Navisworks also does not provide a user-friendly approach to representing and manipulating facility data. As a result, owners who do not have prior experience with the software find it difficult to access and utilize data embedded in the Navisworks model.
VCAD through its Power BI templates provide a more efficient user-friendly alternative to represent and explore facility management data in the model. Using the Blogic’s VCAD service (service to generate Power BI templates for IFC and Revit files) and the generated Power BI template, a facility manager can create multiple dashboards each dedicated to representing the data required to assist in facility operation. Using VCAD, a BIM model and its corresponding data can be viewed using Power BI. Object data can be easily manipulated and presented in a logical manner using visualization tools available in Power BI.
The Power BI template generated through VCAD also comes with a 3D model viewer enabling facility managers to explore and filter the 3D model using data present in the Power BI template. Another advantage of using VCAD is that the user can choose to enable Autodesk Forge 3D Viewer in their Power BI template. Forge 3D Viewer provides Power BI with additional tools to explore the 3D model.
To show case the capabilities of VCAD and Power BI the research team of the Virtual Facilities Research Lab (VFRL) at Virginia Tech uploaded a publicly available Autodesk Revit mechanical model of a 3-story building to the VCAD website. Before the upload, additional asset data including asset manufacturer’s code, asset serial number, asset warranty start date, and asset warranty end date were added. Once the upload and processing of the model was completed, two power BI templates were automatically generated by VCAD:
- Forge Asset Detail
- Forge Revit Asset Color Themes
The Forge Asset Detail template comes with a default dashboard that allows to view the 3D model along with asset properties using multiple tables. By selecting the data in the table, users can filter the 3D view to show only the elements corresponding the selected data. Users can also select the elements in the 3D model and filter asset data in the tables to show only the data corresponding to the selected elements.
On the other hand, if the facility manager chooses to view the 3D model in a color-coded fashion, they can download the Forge Revit Asset Color Themes Power BI template. For the purpose of our case study, the Forge Revit Asset Color Themes Power BI template was explored and tested.
The Forge Revit Asset Color dashboard provides the necessary details to the facility manger as it shows a 3D model where the elements are color coded based on Revit categories, families, and types. Figure 1 shows the default dashboard available to the user. The facility manager can use this dashboard to filter elements in the model on the bases of Revit categories, families, and types. In Figure 2 the model is being filtered so that it only shows elements with category value equal to Ducts.
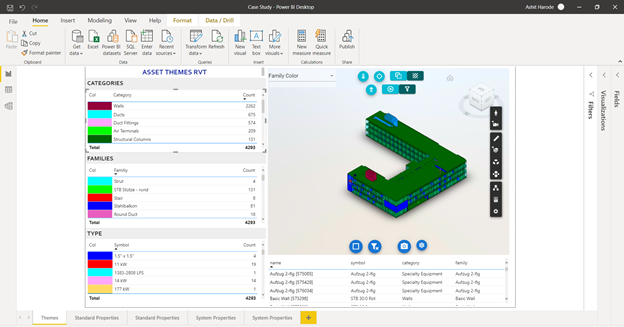
Figure 1: Forge Revit Asset Color Themes Template
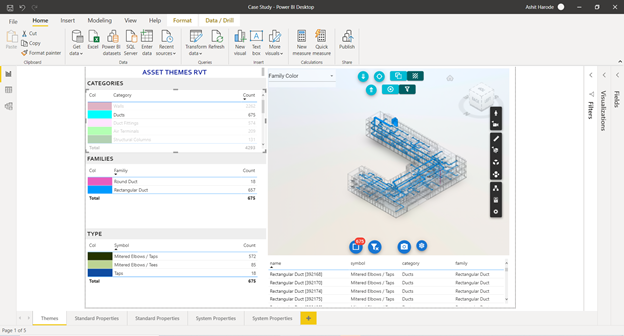
Figure 2: Filtering 3D model and information based on Revit categories
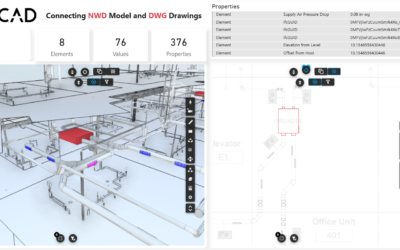
Additionally, the facility manager can also utilize the functions of the Forge 3D Viewer (from Autodesk) to explore the model. For example, as show in Figure 3, using the Forge 3D Viewer a facility manager can explode the 3D model such that elements belonging to the same category are clustered together.
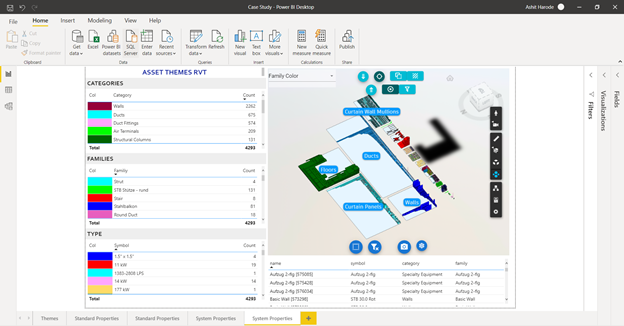
Figure 3: Using Forge 3D Viewer to cluster 3D element based on categories
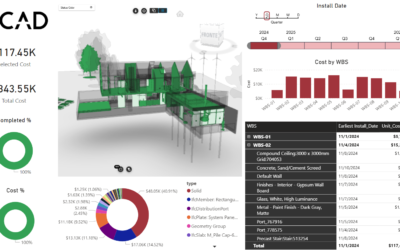
Since effective facility management requires quick exploration of facility data, the two VCAD Power BI templates allow the facility manager to either create new dashboards or can modify the default dashboard to better suit their needs. As shown in Figure 4, a timeline visualization tool can be used to show data and isolate model elements based on asset warranty end date between April 2022 and May 2022.
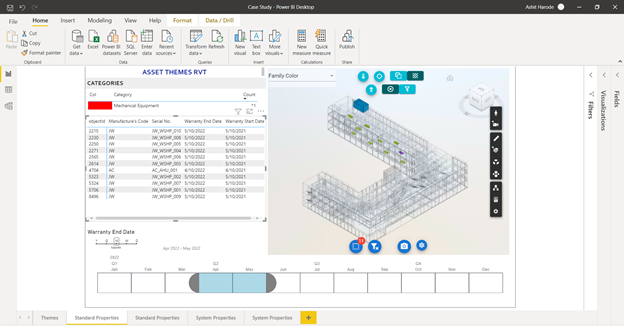
Figure 4: Filtering data and model based on warranty end date
Another advantage of using the VCAD Power BI templates to represent and explore facility data is the ability to use an Artificial Intelligence (AI) tool that can provide multiple ways to visualize facility data. This tool can be helpful to facility managers who want to quickly get specific asset information based on the facility data. This AI-based tool allows facility managers to generate a graphical visual or get information from the model data by simply writing a sentence in natural language. In Figure 5, a bar graph was generated to represent the number of assets that belong to a particular manufacturer.
These AI generated visuals can also link to the 3D viewers and other visuals present in the dashboard. Therefore, it can also be used to quickly filer information or isolate elements in the 3D view. Figure 5 shows how the data and the 3D view were filtered to display only the assets belonging to the same manufacturer with a code JW.
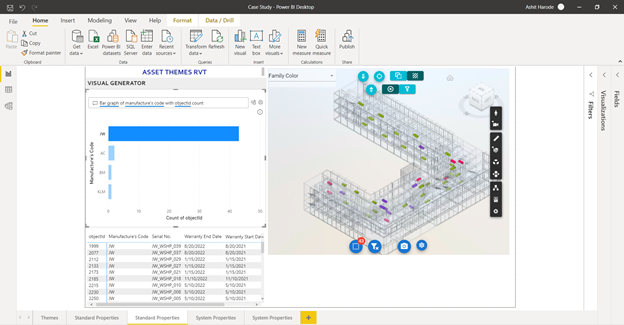
Figure 5: Using AI to generate bar graph for number of assets belonging to a particular manufacturer’s code
Using VCAD facility mangers can explore the use of Power BI in analyzing and representing data to a high level of detail. Since the Power BI dashboards are interactive, they can be used by anyone to access data without any prior knowledge. Figures 6 and 7 shows how a live dashboard can be used to show information for model duct elements in two different levels of the building.
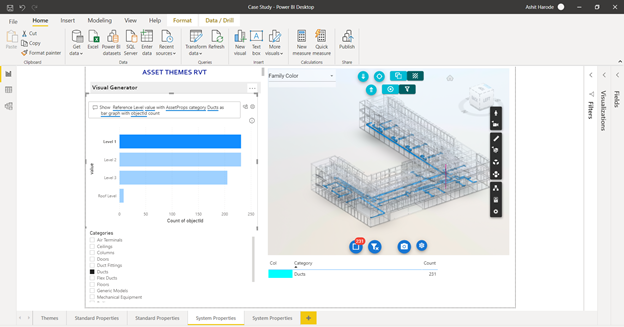
Figure 6: Isolating Ducts in Level 1 of the building
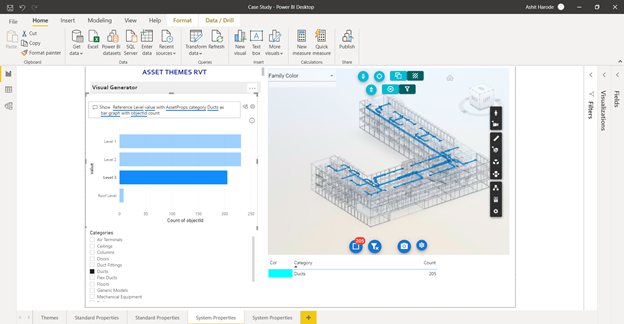
Figure 7: Isolating Ducts in Level 3 of the building
Blogic through VCAD has helped in creating a new effective data sharing channel that is not dependent on the experience of the owner with the software or the availability of expensive licenses.
The research team of the Virtual Facilities Research Lab (VFRL) at Virginia Tech is currently working on a second case study using a mechanical model for an academic institution with a large dataset for facility management. Through this research the team focuses on showing the utility of VCAD and Power BI to respond to emergency scenarios were facility managers are required to react quickly to ensure the smooth functioning of the facility. Results of the case study will be published at the end of spring 2021.
This case study has been generated by the research team at The Virtual Facility Research Lab (VFRL) at Virginia Tech. The team consists of Ph.D. candidates Ashit Harode and Mahnaz Ensafi, and Dr. Walid Thabet.