Introduction
As part of the MSc FHNW VDC master’s program, Impact Hub Zurich provided us with a basis for our integration project in form of a real construction task. In this student project, we first had to identify the customer’s goals and derive project objectives from them.
After an introductory presentation by Impact Hub Zurich, it quickly became clear how important it is for them to have a diversity of groups of people and uses in the building project. This is linked to the desire for the greatest possible social density in this building.
Aim of the project work
This project aimed to improve the clarity of the various uses and types of people that have already been defined by the Impact Hub Zurich and to provide a tool with which an analysis of the social density is already possible during the planning phase.
To make this possible, various levels of information management were used. The problem was first described on the semantic level. In a further step, the problem was recorded on the conceptual level in a class and an object diagram. This was important to understand the relationships between the rooms, uses, and types of people.
It also had to be defined what exactly should be analysed with the tool and what kind of information would be needed for it:
- In Power BI, it should be shown spatially which people can be found in which utilisations.
- It should be shown how many different types of people are in one utilization.
- It should be clear at what time the utilisations are active.
Workflow
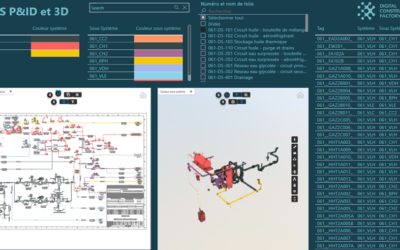
To use the tool in planning, it is important that changes can be mapped quickly and easily in the tool. On the one hand, the room model that was created in ArchiCAD must be able to be adapted quickly and easily in Power BI. On the other hand, it must also be possible to expand the database in the form of an Excel table and update it in Power BI. The analysis is carried out in Power BI itself and can be repeated after each adjustment.
The room model must be exported from ArchiCAD in the IFC format and saved under the same name if changes are made. In this way, the file can simply be overwritten on the VCAD platform, and the changes are automatically adopted when the Power BI file is updated.
The Excel file is linked directly in Power BI and changes are updated with a push of a button in Power BI.
This means that the effort required to update the sources in Power BI is limited when making adjustments and the tool can be used well in planning.
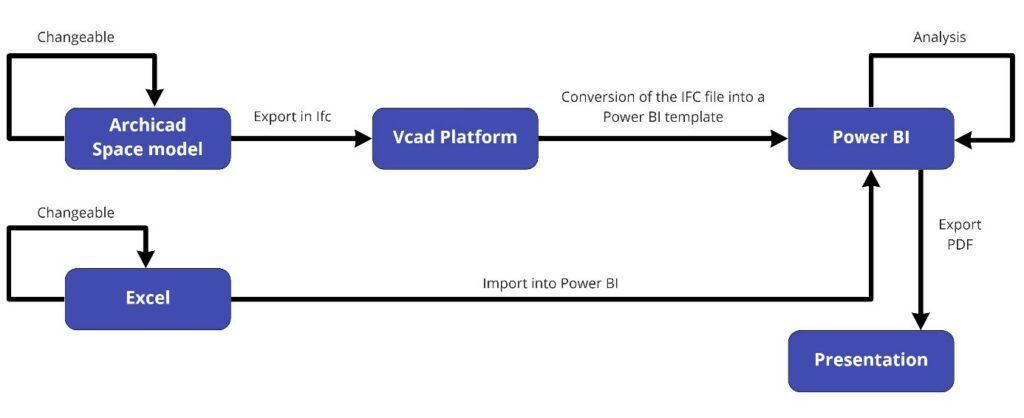 Figure 1: Graphical representation of the workflow, Michel Gerber
Database
The information required for the analysis in Power BI was stored in two Excel tables. This information includes the types of people, the utilisations and the rooms themselves. The types of people have also been assigned to the uses and the rooms in the table. In a second list, the uses were allocated to a period. This shows when the usage is being actively used.
Space model
To use the tool in the early planning phases, the effort for creating the 3D model must be as low as possible. Therefore, just the spaces were modelled in the BIM authoring software ArchiCAD and the necessary information is stored. To get an overview of this information, a room list was used with which it is possible to adjust the information of a room directly.
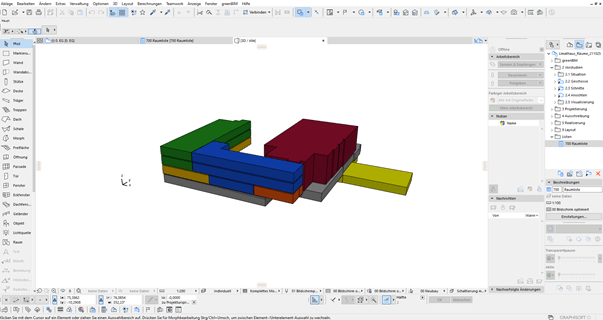 Figure 2: Space model, Michel Gerber
Power BI
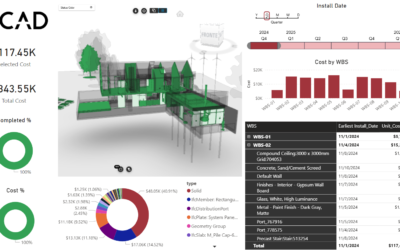
To create the link between the room model and the Excel lists, the Visual VCAD is used in Power BI. After the space model has been uploaded to the VCAD platform as an IFC file, various templates for Power BI can be downloaded, whereby the room model is synchronized directly with the platform. In the next step, the other sources can then be linked.
In this case, the Excel lists were not automatically linked to the IFC file by the program itself. This connection, as well as the connection between the individual Excel lists, must be checked independently in the “Relationships” area and missing links must be created, where necessary, by oneself. But this is a small and one-time effort.
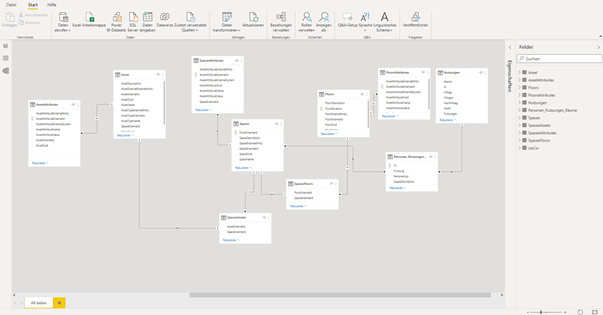 Figure 3: Relationships between sources in Power BI, Michel Gerber
With the template that is downloaded from the VCAD platform, a rough layout of the dashboard is already available. This can be freely adapted according to your requirements and supplemented by further diagrams and lists.
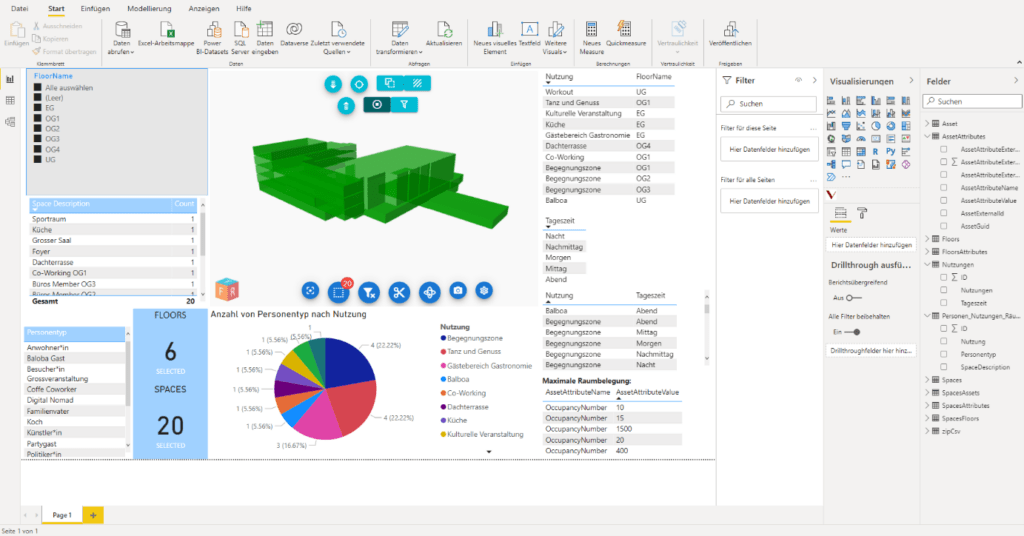 Figure 4: Dashboard in Power BI, Michel Gerber
Analysis of social density
To analyse the social density and thereby the goal of the Impact Hub, the different utilisations and types of people can be clicked on in Power BI. If, for example, a utilization is clicked, all other lists change interactively, so that only the relevant information about the clicked utilization is available. For example, different rooms can be compared with one another based on the number of types of people encountered in one use. For example, it can be seen that four different types of people can be found in the utilization of “Tanz und Genuss”. Therefore, there is a greater mix of types of people and, associated with this, greater diversity, and greater social density.
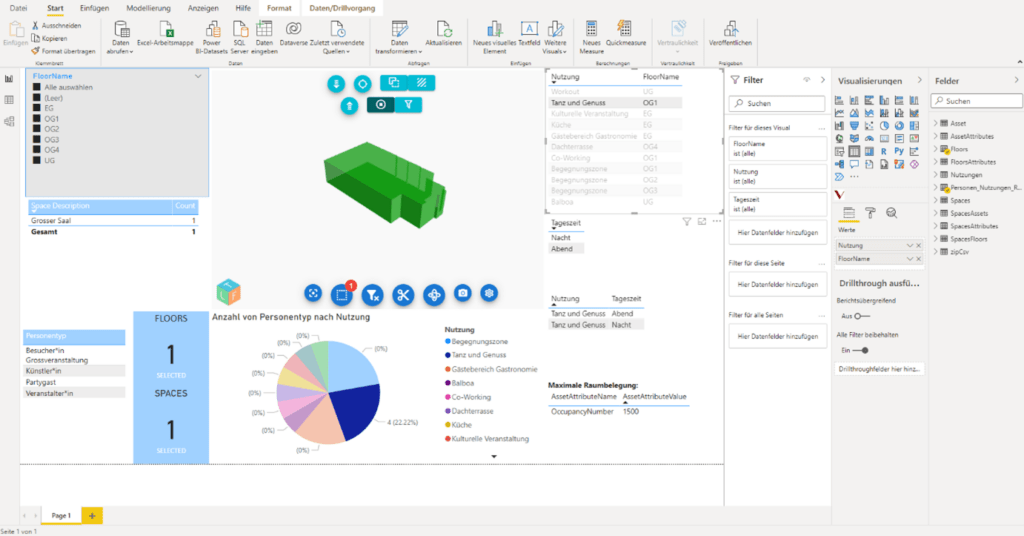 Figure 5: Analysis of the space “Tanz und Genuss” in Power BI, Michel Gerber
It turns out that rooms with multiple utilisations also contain more different types of people.
To be able to increase the social density, it must be questioned whether rooms with only one utilization can be expanded with a secondary use. In this way, other types of people could have access to this utilization. This could then become active when the primary utilization is not in operation anyway.
Conclusion
The effort to create this tool is minimal. What is time-consuming, however, is the exact description of the problem, the definition of the requirements for the analysis and the identification of the required information. Of course, knowledge of the Power BI program must also be available for a quick creation.
Power BI, together with the Visual VCAD, enables information from a table to be spatially located in a model. The tool fulfils the goal of a better overview of the types of people, uses, and rooms described at the beginning.
Article by Michel Gerber, student MSc FHNW VDC, Switzerland