When we talk about BIM, most people think of a 3D model of a building, a digital representation full of geometry, materials, and technical details. But the real power of BIM comes to life when we start adding other dimensions: time, cost, and data analysis.
In recent years, tools like VCAD have made something powerful possible: the ability to visualize, analyze, and manage a project in 5D, directly from an interactive dashboard.
In this article, we share a practical example of a 5D BIM report, to show what it really means to “build digitally.”
What is a 5D Report and Why Does it Matter?
While 3D represents the physical structure, and 4D adds the timeline (when things happen), 5D brings in the cost dimension (how much things cost). All of this is connected directly to the model.
In practice, this means you can click on a wall in the 3D model and instantly see:
- how much it costs,
- when it will be installed,
- how much of it is completed,
- and what impact it has on the overall budget.
You can filter by time periods, like a specific quarter, and see how much you’ll spend in Q1 2025. Or you can focus on a specific construction phase and measure its actual progress, physically and financially.
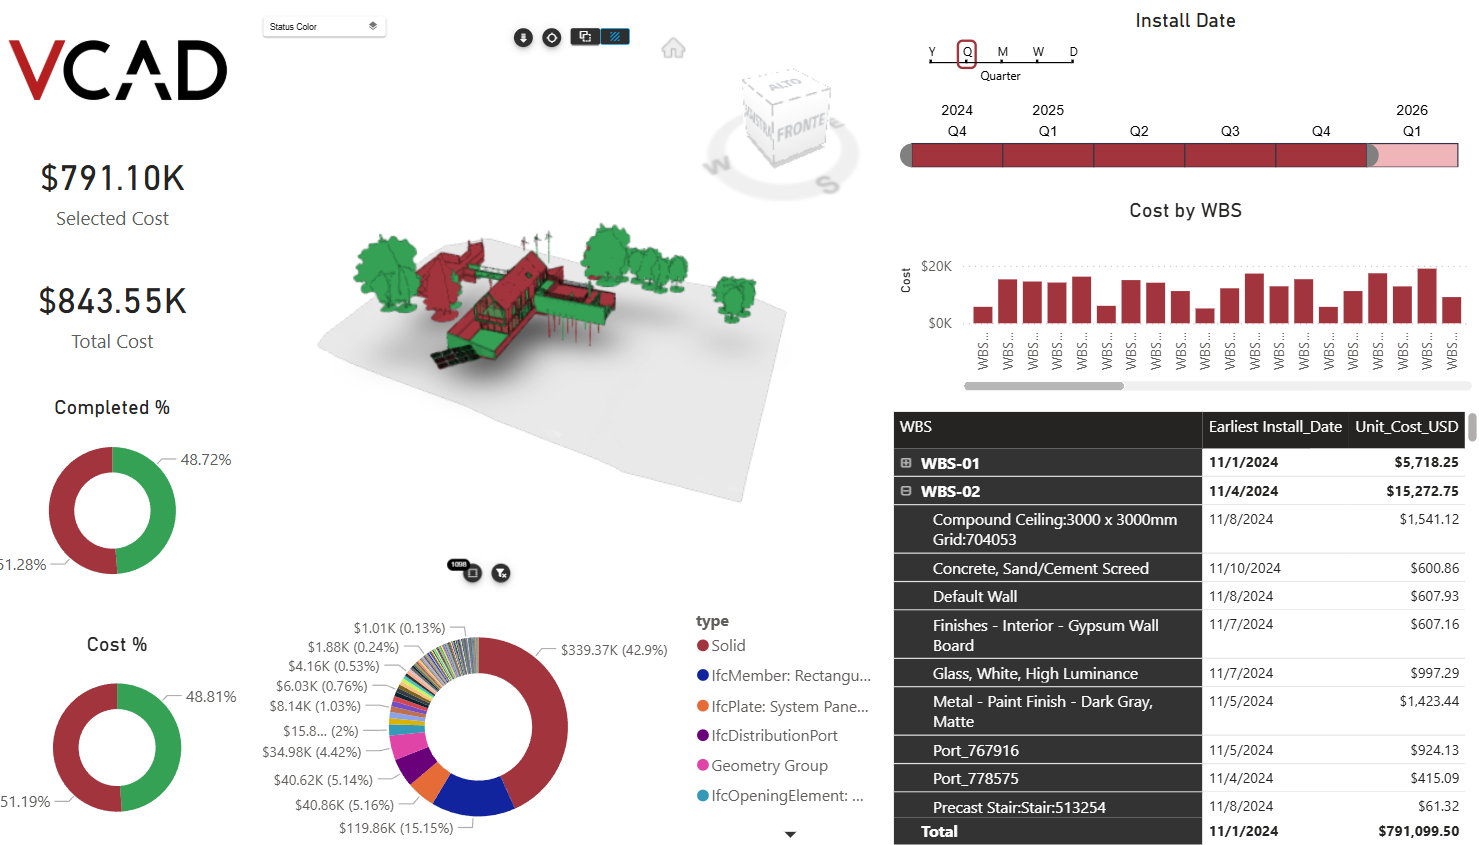
A Look Inside the Report
The example report shown below was created using VCAD. It takes an IFC BIM model and transforms it into a live, interactive experience:
- At the center, a navigable 3D model, color-coded to show progress status.
- On the left, key figures: selected cost, total cost, completion percentages.
- Below and to the right, charts and tables show where money is being spent, which elements have been installed, and how the budget is distributed across components.
Every interaction updates the whole dashboard. It’s a constant dialogue between shape, time, and cost.
A Simple Example, But Very Close to Reality
Even though this is just a sample report, it reflects exactly what happens in real-world projects:
- The project manager checking if costs align with the schedule.
- The client who wants to understand what’s already done and what’s still pending.
- The technical team planning the next installations, matching dates with budget and priorities.
Thanks to the WBS structure, every component is traceable. And with visual filtering by type (Ifc), you can quickly see, for example, how much of the total cost is due to fixtures or special materials.
Conclusion
The example shown here is just one of many ways 5D reports can be created using VCAD. Whether you’re working in construction, infrastructure, or real estate, combining geometry, schedule, and cost into one integrated view gives you a strategic advantage in managing complex projects.
With VCAD, this data becomes accessible, interactive, and tied to the model, making BIM not just about design, but about business intelligence.