COGNITIVE DIGITAL TWIN: ADVANCED BUILDING AND ENERGY MANAGEMENT IN A MULTITENANT BUILDING
ABSTRACT
The complexity of modern buildings, consisting of increasingly connected and automated plant networks, is growing exponentially year by year. With this increasing complexity comes the need to manage massive volumes of data for an industry, AECO (Architecture, Engineering, Construction and Operations), that has always had a pronounced gap in digitization (McKinsey Global Institute).
Emerging technologies such as BIM, IoT (Internet of Things), Big Data Management, Data Analytics, and even artificial intelligence could offer new tools for building managers that, when implemented, could enable:
- Optimizing energy efficiency;
- Reduce operating costs;
- Extend the service life of equipment;
- Improve the experience of occupants.
In practice, it would be possible to aspire to the realization of a Cognitive Building capable of supporting building managers in a process of data-driven decision making.
In the prototype I made, a Digital Twin prototype of a real existing (multi-tenant) office building was implemented.
The available data allowed me to investigate the following application areas:
- Space Management;
- Energy Management;
- Predictive maintenance.
Based on the available data and how it was collected, a workflow was set up, the final output of which is a PowerBI dashboard to dynamically explore each area of the Digital Twin. At an initial evaluation step of the prototype implemented, building managers appreciated the communication effectiveness of the dashboard and felt that their understanding of the building and its behavior would improve if the tool were adopted so as to make their actions more targeted and effective.
Given the effectiveness of the Digital Twin prototype, an evolution of the data workflow has been studied that could make the prototype a fully mature Digital Twin capable of achieving even more advanced levels of autonomy and interconnection.
KEYWORDS
- Digital Twin;
- Facility Management;
- Cognitive Building;
- Energy Management;
- Space Management;
- BIM;
- Data Analytics;
- Predictive Analytics;
- Machine Learning;
- Data Visualization;
- KNIME;
- Power BI;
- VCad;
- Blogic.
INTRODUCTION
The implementation of a “smart” building as well as its management is becoming a complex activity that requires the integration of increasingly specialized disciplines as the integrated technological components become numerous and diverse.
Modern buildings include a wide range of equipment, from HVAC systems to plumbing, lighting, and security, that all contribute to the buildings’ operation. These elements are increasingly accompanied by some degree of automation so as to provide a modern, responsive experience for the occupants.
The integration of building management systems coupled with the analysis of the data they generate can allow building managers to gain visibility into complex networks of equipment, sensors, and devices.
Through a thorough process that consists of:
- Data collection and processing,
- Identification of key parameters and behaviors,
- Forecast generation,
- Alert automation,
a building manager can “see” what is happening inside a building at any given time and understand the relationships among multiple systems and variables both environmental and generated by user behavior.
Such an evolved approach cannot go without adopting a new concept of Operations that makes extensive use of methodologies such as Big Data, Data Analytics, and Machine Learning.
If skillfully set up, such an approach would give building managers access to a new set of information that would allow them to define more accurate parameters for possible alerts, simplify maintenance, and implement effective automation strategies that: (i) optimize energy efficiency, (ii) simultaneously reduce operating costs, (iii) extend equipment life, and (iv) improve the occupant’s experience. In practice, it would we could aspire to the realization of a Cognitive Building.
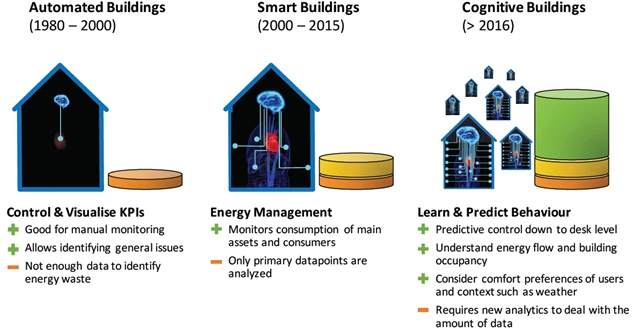
Figure 1 representation of the evolution of buildings and their integration with management systems
COGNITIVE DIGITAL TWIN
The first definition of the Digital Twin was coined in 2003 by Michael Grieves; over time it has been refined and detailed. The following definition from 2017, also by Michael Grieves, will be adopted in this paper: the digital twin is a set of virtual information constructs that completely describe a potential or actual physical product from the atomic level to the macroscopic level. At its optimal level, any information that could be obtained from inspection of a physical product can be obtained from its digital twin.
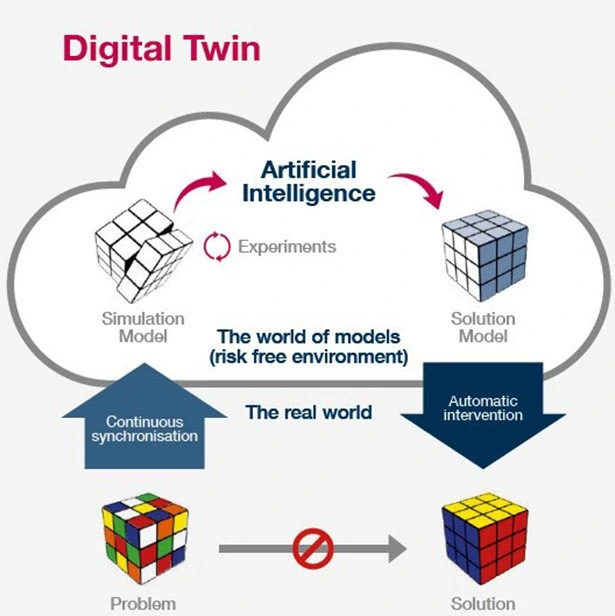
Figure 2 representative image of the application potential of a Digital Twin
The DT concept emphasizes the following key elements:
– Represents an actual (or potential) physical object;
– It is not just a digital model in that it maintains relationships and interactions with the physical object;
– You can explore it as if it were a real object;
– You can link it to relevant data and time series to ensure a closer fit with reality;
– Simulates patterns and behaviors with varying levels of reliability.
The digital twin therefore aims to increase operational efficiency, resource optimization, resource management, cost savings, productivity and safety.
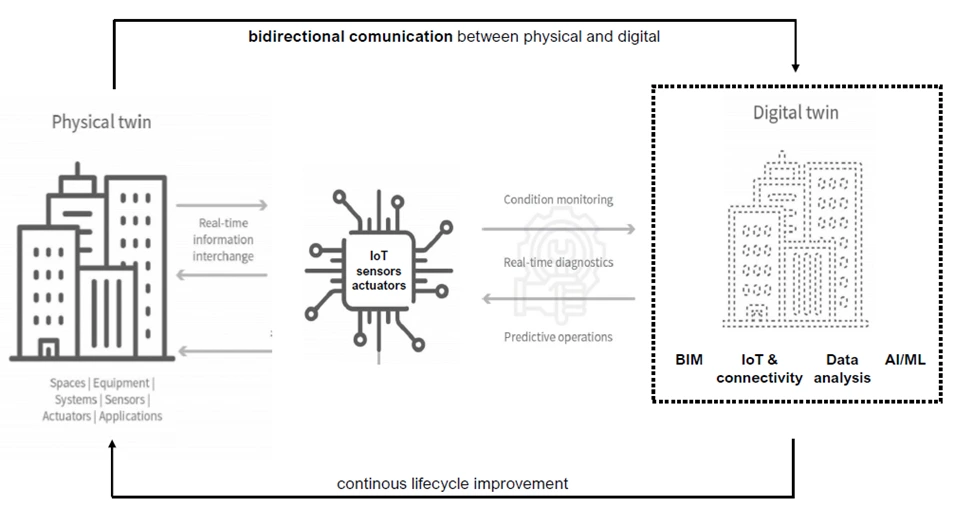
Figure 3 workflow of a Digital Twin
The evaluation of a Digital Twin is based on 5 levels of complexity starting with a simple digital model (level 1). As the model evolves, feedback and the ability to extract reliable predictions increase in importance. At higher levels of complexity (levels 4 or 5), machine learning capability, generalization possibility, and scalability potential come into play.
The metrics on which the Digital Twin is evaluated are:
-Autonomy, ability of a system to act without human input.
-Intelligence, the ability to replicate human cognitive processes and perform more or less complex tasks.
-Learning, the ability of a twin to automatically learn from data to improve performance without being explicitly programmed to do so.
-Fidelity, the level of detail in a system, the degree to which measurements, calculations, or specifications approach the true value or desired standard.
Some technologies better than others have proven to be enablers for the full development of a Digital Twin:
1-Computing capacity capable of processing a significant amount of data;
2-Sensors capable of building automation and, in a broader sense, increasingly smart buildings;
3-Data Visualization to enable their best possible use.
DATA ANALYTICS AND DATA VISUALIZATION
The term data analytics is used to refer to the methods and techniques used to extract information from data, that is, it represents how raw data can be transformed into something useful (from data to information) and support decision making.
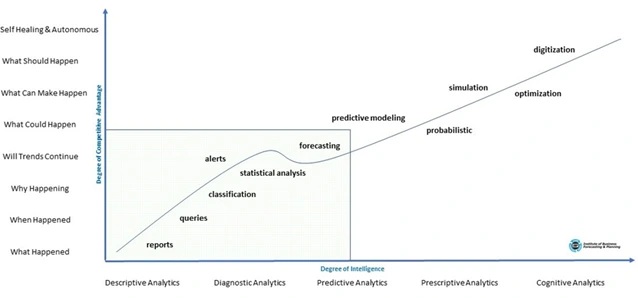
Figure 4 Types of Data Analytics
There are three different types of data analytics, each with its own set of possible applications:
-Descriptive analytics: is the starting point of an analytical process. These methodologies focus on describing the historical data collected to make it readable. They answer the generic question “what happened?” Associated with descriptive analytics is a data visualization model that is either static (Pdf, Excel, PowerPoint, etc.) or semi-interactive (e.g., a dashboard with a web interface);
-Predictive analytics focus on answering questions such as, “why did this happen?”, “what will happen?”. These methodologies are based on more sophisticated analytical and probabilistic techniques (based on artificial intelligence) through which it is possible to recognize and describe patterns of data behavior, allowing us to predict possible future scenarios;
-Prescriptive analytics: indicates what actions need to be taken to achieve a given goal, thus answering the question, “what to do?” Typical tools of this type of analysis could simulate numerous alternative scenarios and screen them to return the best combination that maximizes profits and reduces costs.
Closely related to the concept of data analytics on display above is a nod to the concept of data visualization that was applied in the implemented Digital Twin prototype.
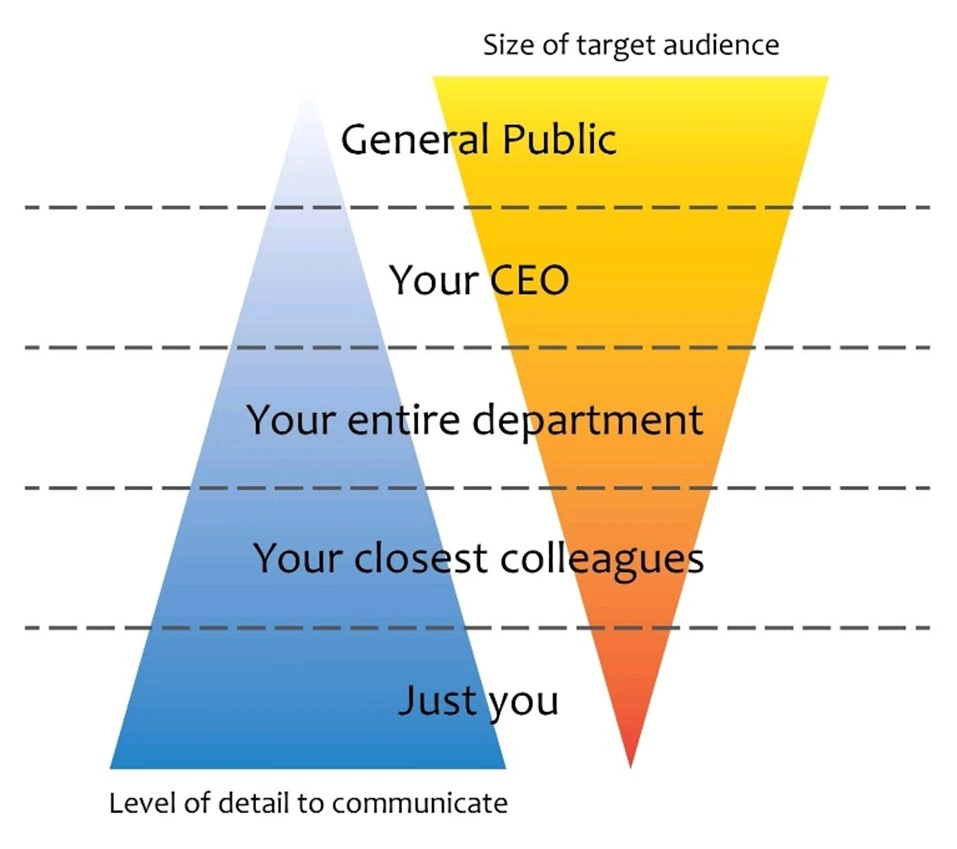
Figure 5 of the relationship between the level of detail of a piece of information and the size of the information’s target audience
The essential goal of data visualization is to transfer a message from one “emitter” subject to a “receiver.” To be effective in this communication process the receiver must understand the meaning of the message that the initial subject wanted to communicate.
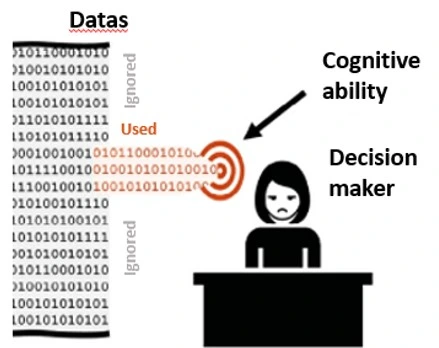
Figure 6 information with ineffective data visualization
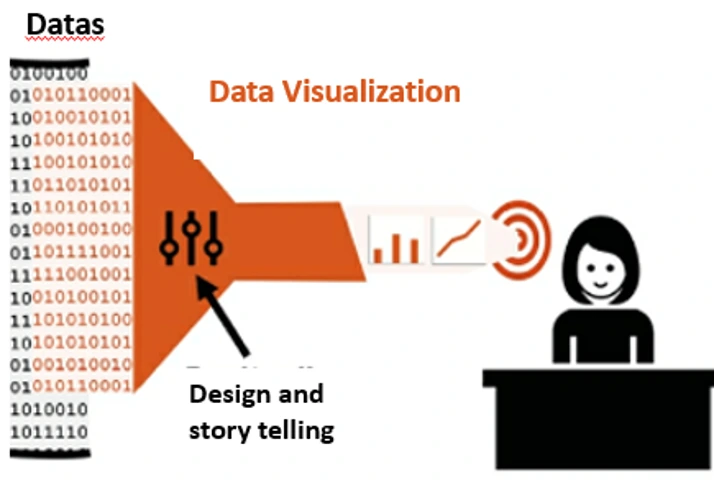
Figure 7 information with effective data visualization
The effectiveness of the communication process requires carefully balancing the level of detail one wishes to impart to the information. As illustrated in the images, there is an inverse relationship between the level of detail and audience size.
DATA WORKFLOW
Pivotal element for data processing will be the KNIME application.
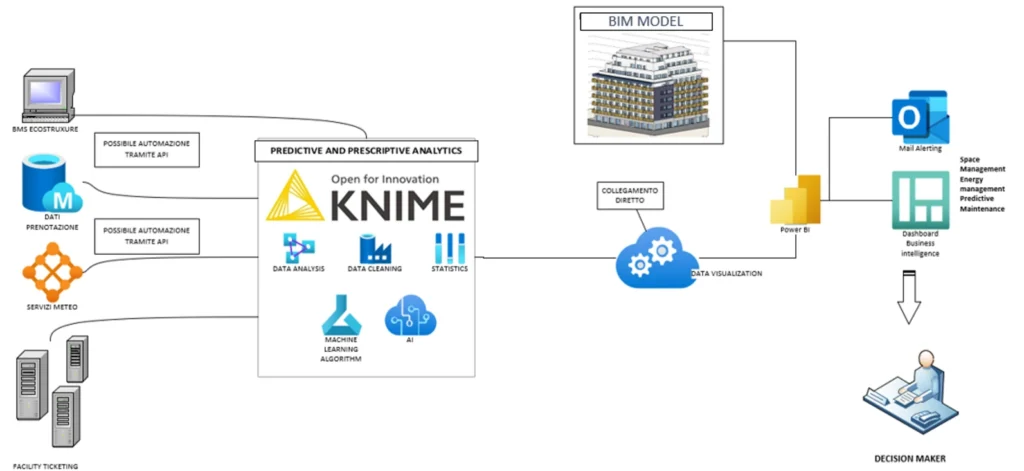
Figure 8 dataflow of the Digital Twin prototype
The data analytics platform was chosen because of the potential and versatility it offers and, above all, because of the no-code/low-code approach that allows effective processing to be provided quickly and, through appropriate pre-programmed nodes, direct output to business intelligence tools (e.g., Microsoft PowerBI). The use of this platform has greatly facilitated the data analysis work by allowing us to avoid possible frustrations due to the syntax of any programming language (e.g., Python).
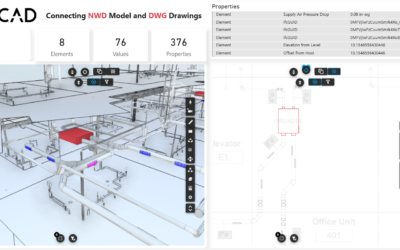
Besides the Data Analytics platform, an additional data visualization tool (the aforementioned Microsoft PowerBI) was used to effectively represent the information inferred from the data with appropriate dashboards.
Integrated along with this tool is a particularly high-performance application for the representation of BIM models: VCad (from the company BLogic). Through the use of this application, it is possible to explore an information model (generated with BIM Authoring SW) even for users not accustomed to the use of dedicated SW.
The integration on the PowerBi platform allows data from even external sources to be “hooked up” to individual three-dimensional model components for more effective use and exploration.
In addition, through the publication of the report to Microsoft®’s WebAPP PowerBI Service, automatic email Alerting services have been set up that are useful for sending appropriate communications according to certain KPIs. We can think of this functionality as an initial exploration of the prescriptive analytics capabilities.
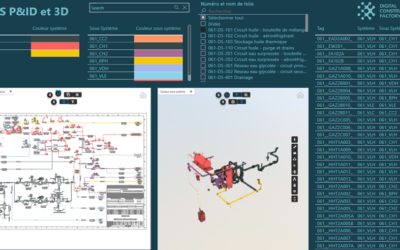
PROTOTYPE DIGITAL TWIN: SPACE MANAGEMENT
The data I relied on is related to reservations at workstations and meeting rooms. From the first exploration of the data, I found that the reservation data is not always the same as the detection data at the entrance turnstiles. This data reconciliation issue should be verified with the time-stamping data at the turnstiles, but it cannot be solved at present for privacy reasons. However, the problem could be circumvented through an edge computing service that can bring in the actual attendance data while eliminating the privacy data.
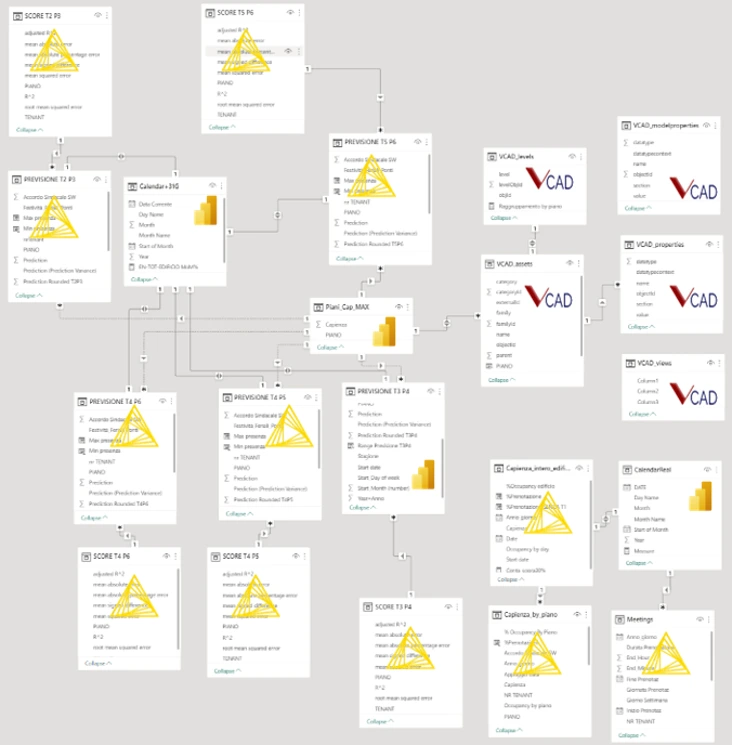
Figure 9 data model on PowerBI
By processing the booking data through the KNIME platform combined with the visualization capabilities offered by VCad, it was possible to explore the information through dynamic dashboards that could be queried based on various criteria (day of the week, floor, tenant) so as to create a comprehensive descriptive analytics framework not only for workstations but also for meeting rooms.
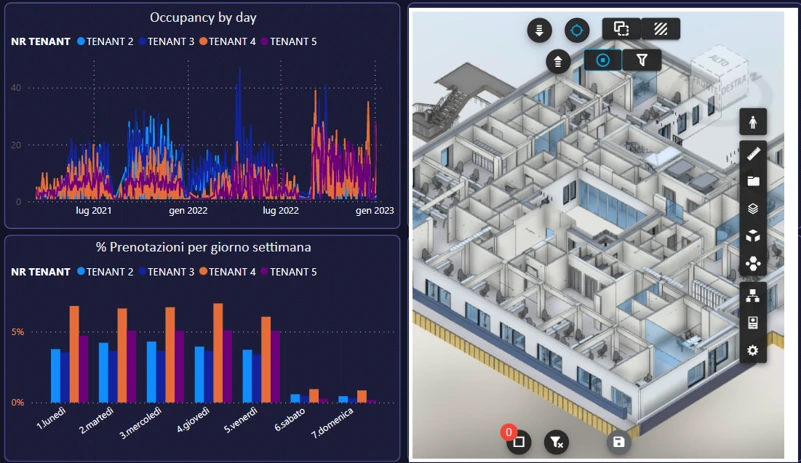
Figure 10 Space management data exploration dashboard – desk booking
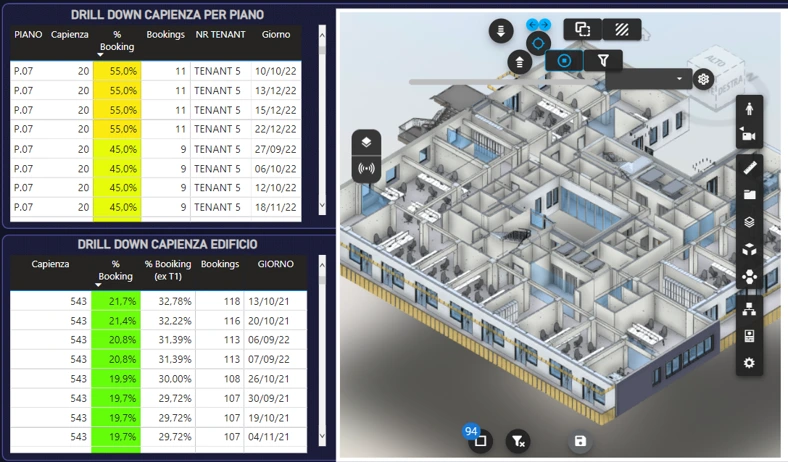
Figure 11 Space management data exploration dashboard – desk booking detail
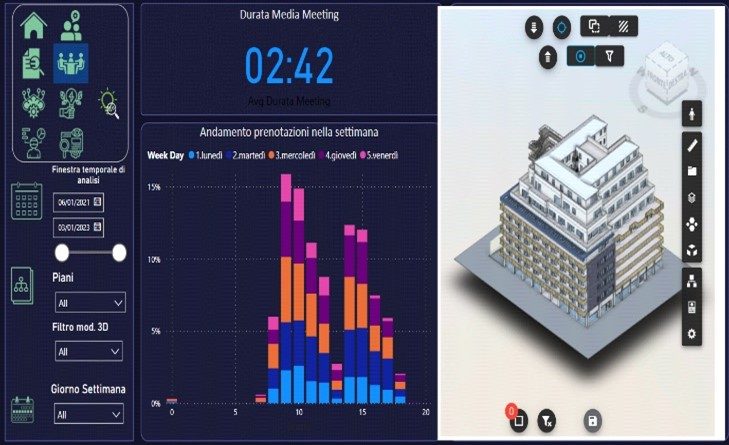
Figure 12 Space management data exploration dashboard – meeting room booking
Given the available data, I was able to estimate the possible occupancy rate in the following period (30days).
To set up the machine learning algorithm, I identified the dummy variables that seemed most appropriate (season, weekday or holiday, holiday bridges) and then calibrated a Tree Ensemble algorithm. Unfortunately, the prediction accuracy percentage is not high due to the relatively short period for which data was available (2 years). To increase the reliability, a range of possible percentage was created by adding the square root of the mean square error to the accuracy value. According to the statistical theory of Gauss distribution, with this expedient, a percentage accuracy of about 70 percent can be achieved.
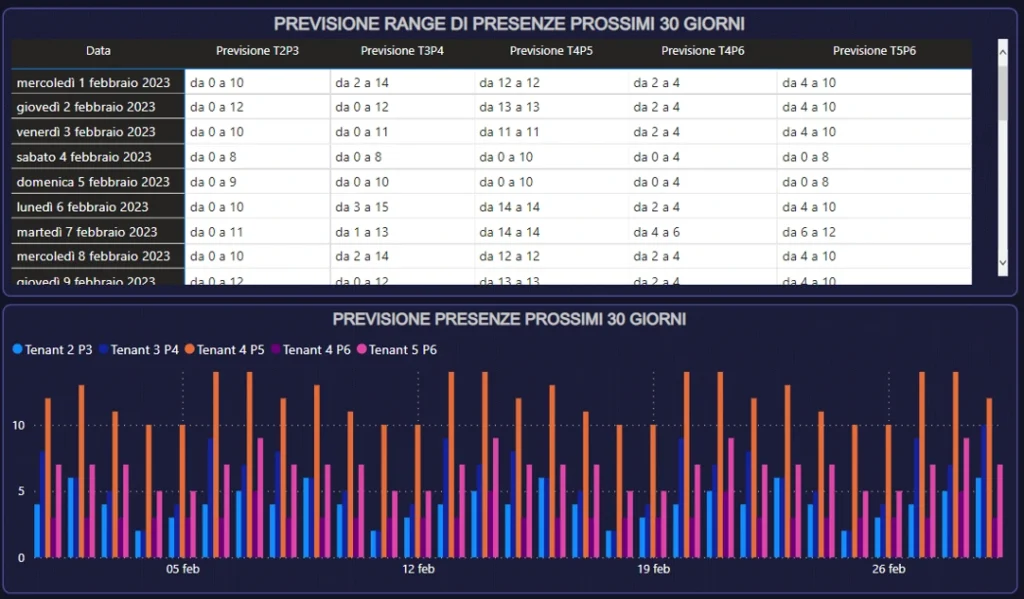
Figure 13 Dashboard space management – Predictive 30days
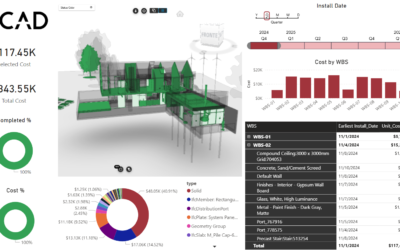
ENERGY MANAGEMENT
The available data allowed for a very thorough level of descriptive analysis. A critical element was identified in the way the data was collected in that the data resides on proprietary systems of the BMS manufacturer and can only be explored on HW attested to a corporate VPN. However, following the results obtained from the present prototype, the full-scale deployment of the Digital Twin may overcome this difficulty.
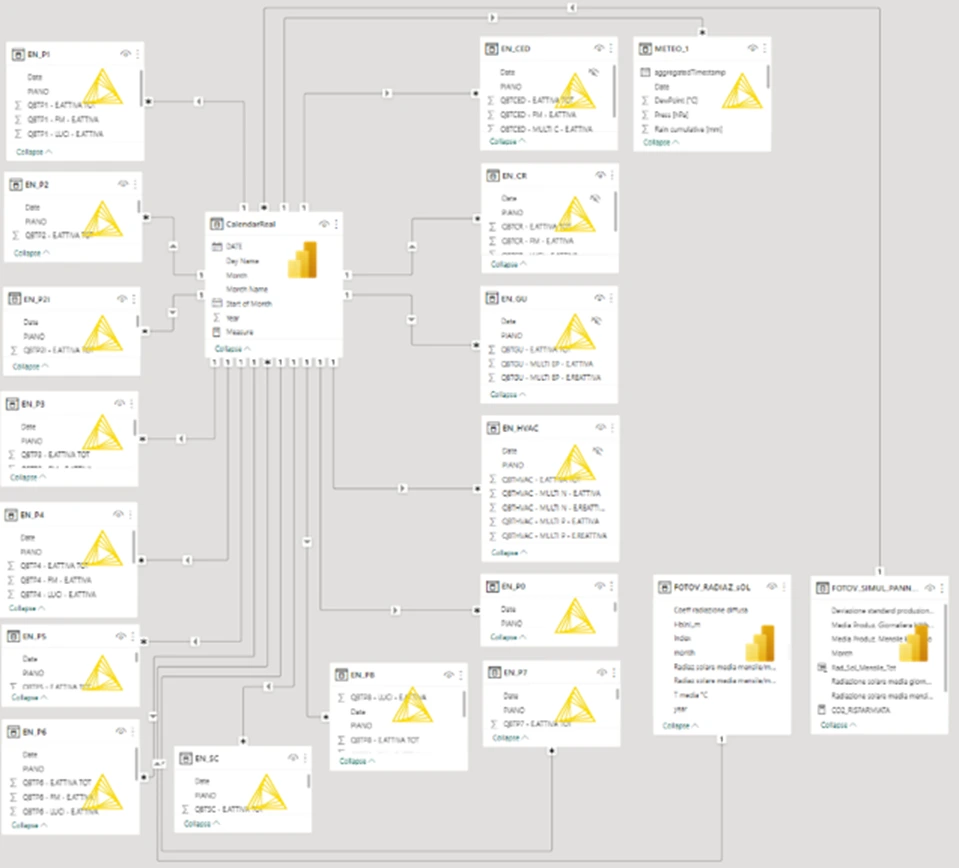
Figure 14 Data model on PowerBI
In each case, the quality of the available data was sufficient to allow the investigation of the consumption trends of each system component for each individual floor.
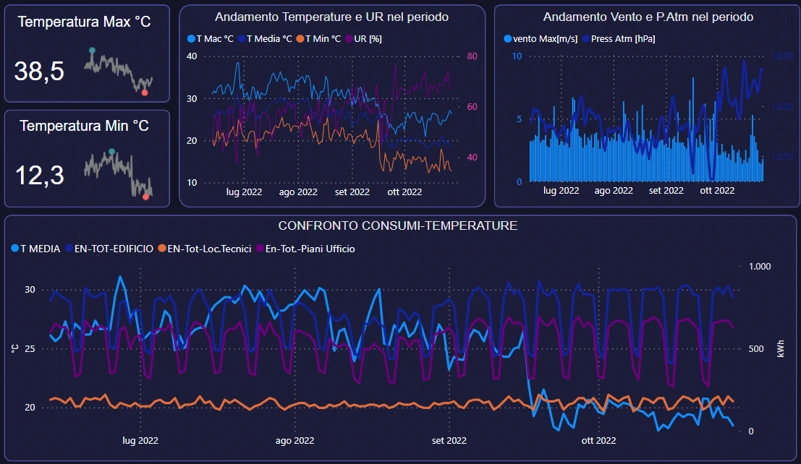
Figure 15 Energy management data exploration dashboard
The analysis of the data allowed me to:
-Identify the programming logic of the system. The operational logic is decoupled from the number of attendances within the floor. If the building is active on a working day, the building’s energy consumption is not impacted by the number of staff present.
-Verify that the plant’s programming does not follow outdoor temperature trends. Much more realistically, the plant seems to follow an hourly-seasonal programming logic.
Given the availability of data, a “what if” scenario was set up. In this scenario, we assumed a headquarter assigned to a single tenant instead of multiple tenants, and imagined applying a business procedure whereby if a minimum percentage of the total reservation availability was not met on a given floor, then the reservations where automatically transferred to a different floor. The minimum requirement was set at 20%
Current reservation data tell us that during the past year, due to pandemic, only on 83 out of 250 working days met the minimum 20% reservation number. If this rule had been applied, 2500kWh could have been saved per floor for the lighting system and as much for other consumption components. The information of possible savings was also declined in units of CO2 and Oil Tons Equivalent.
PREDICTIVE MAINTENANCE
Following an assessment, I found an objective scarcity of data that could enable an in-depth level of descriptive analytics.
The maintenance dashboard was therefore limited to a lite analysis of operational maintenance. In the graph, a decomposition tree can be seen with identification of the percentages of interventions broken down by category and subcategory.
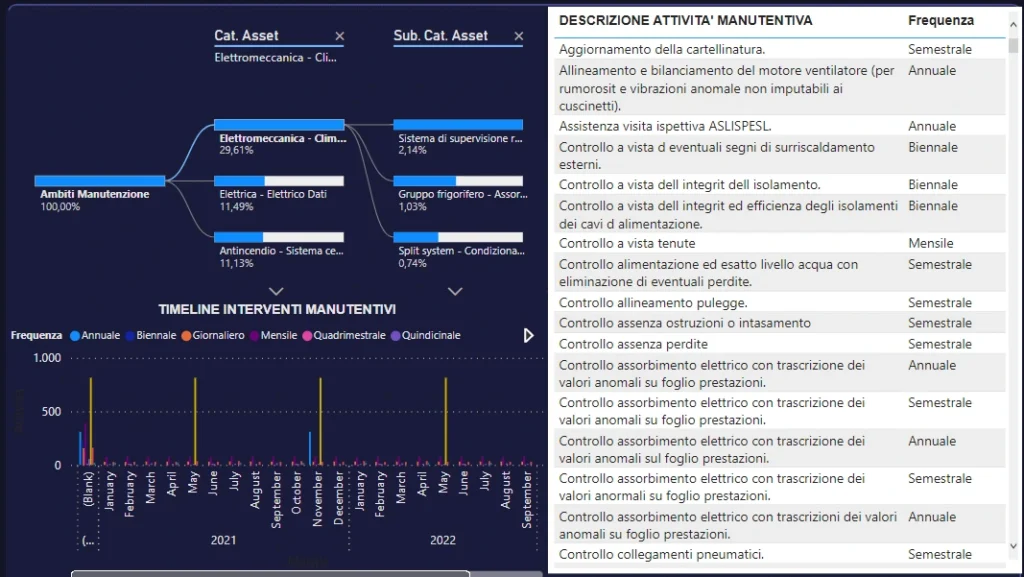
Figure 16 Operational maintenance data exploration dashboard
WORKFLOW EVOLUTION
In the conclusion of this analysis of the implemented Digital Twin prototype, I would like to pause to comment on some of the key aspects that, in my view, would enable a fully mature Digital Twin level to be achieved.
The key aspects identified can be divided into two types:
– Type 1, characterized by incomplete (more or less partial) data, which would allow more effective data analytics and, consequently, significantly higher quality of results. Part of this category, in addition to the limitations dictated by the quality/quantity of the data, are the limitations related to the ineffectiveness/automation of their collection.
– Type 2, characterized instead by the need to include components and new features aimed at improving the two-way connection between the digital and real worlds as well as the data storage of simulations.
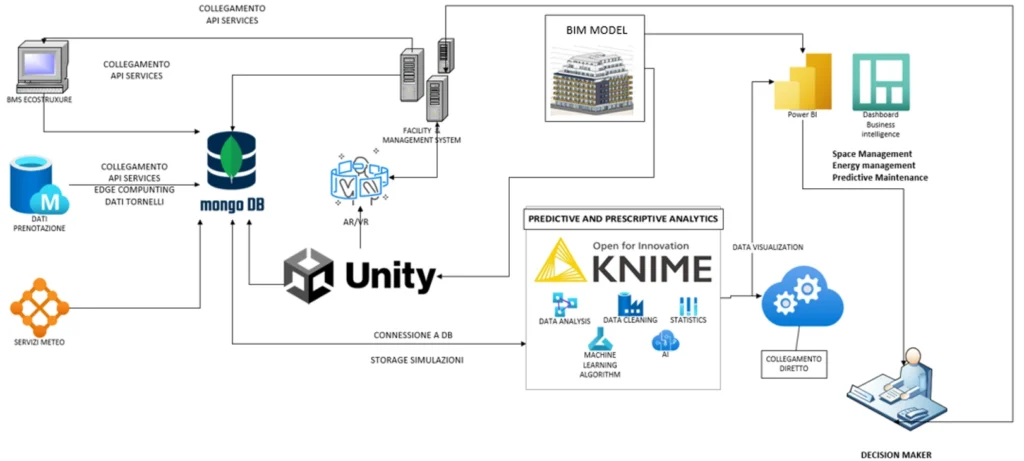
Figure 17 Possible dataflow for a mature Digital Twin.
As can be seen in the image, some additional elements have been included in the proposed evolution of the dataflow:
- An AR-VR-MR data exploration service via Unity platform.
- A DB service for unstructured data that can receive both structured data from BMS systems and unstructured data for future implementations.
CONCLUSIONS
The prototype digital twin implemented focused on the use of KNIME, Power BI, and VCAD services. The services were chosen with the goal of testing a digital twin that would explore across the board all possible capabilities offered by currently available data.
The development of the Digital Twin prototype was long and laborious, but it produced a robust and very promising result with potential for flexibility and expansion. In fact, the prototype can serve as a first step for the introduction of Digital twin also on other sites of the same group of companies so as to support and improve asset management and building managers’ needs and, in an even broader perspective, business decision-making processes as well.
 BIO PIERPAOLO VERGATI
Graduated in Construction Engineering-Architecture from ‘La Sapienza’ University of Rome (2007),and has worked as an engineer at the ATsrl firm in Rome as a structural and systems designer.
Has have worked for the CDP Group since 2011 where He has held the position of Senior Project Manager since 2020.
He received a Master’s degree in Earthquake Engineering from the Polytechnic University of Milan (2021), and in 2023, he received a Master’s degree in Construction Digital Twin & Artificial Intelligence from ‘La Sapienza’ University of Rome.