Managing the lifecycle of real estate units, from availability to sale or rental, is a key aspect of property management and facility oversight. The Unit Lifecycle Report, provides an interactive and visual way to monitor changes in the status of each unit over time, offering the user an immediate understanding of the portfolio’s performance.
Use Case Overview
This report addresses the needs of real estate and property management professionals to monitor the operational status of residential, commercial, or mixed-use units within a building or complex.
In this example we support both sales and rental management workflows, allowing users to visualize which units are for sale, rented, vacant, or under maintenance, and how these states evolve over time.
By combining BIM data with business intelligence, the report delivers insights that go beyond traditional spreadsheets, enabling decision-makers to see data directly on the 3D model, making spatial context a core part of the analysis.
Who Can Benefit
- Real Estate Managers who need to keep track of unit availability and performance over time.
- Property Developers interested in monitoring the progress of unit sales or leases across multiple buildings.
- Facilities and Operations Teams managing occupancy, maintenance cycles, and refurbishment phases.
- Executives and Analysts seeking to integrate BIM and operational data into unified dashboards.
Report Overview
The Unit Lifecycle Report is composed of multiple pages designed to provide both an overview and detailed analysis of the units’ statuses.
Users can switch between current data views, showing the latest available information, and historical visualizations that reveal how each unit’s lifecycle has changed over time.
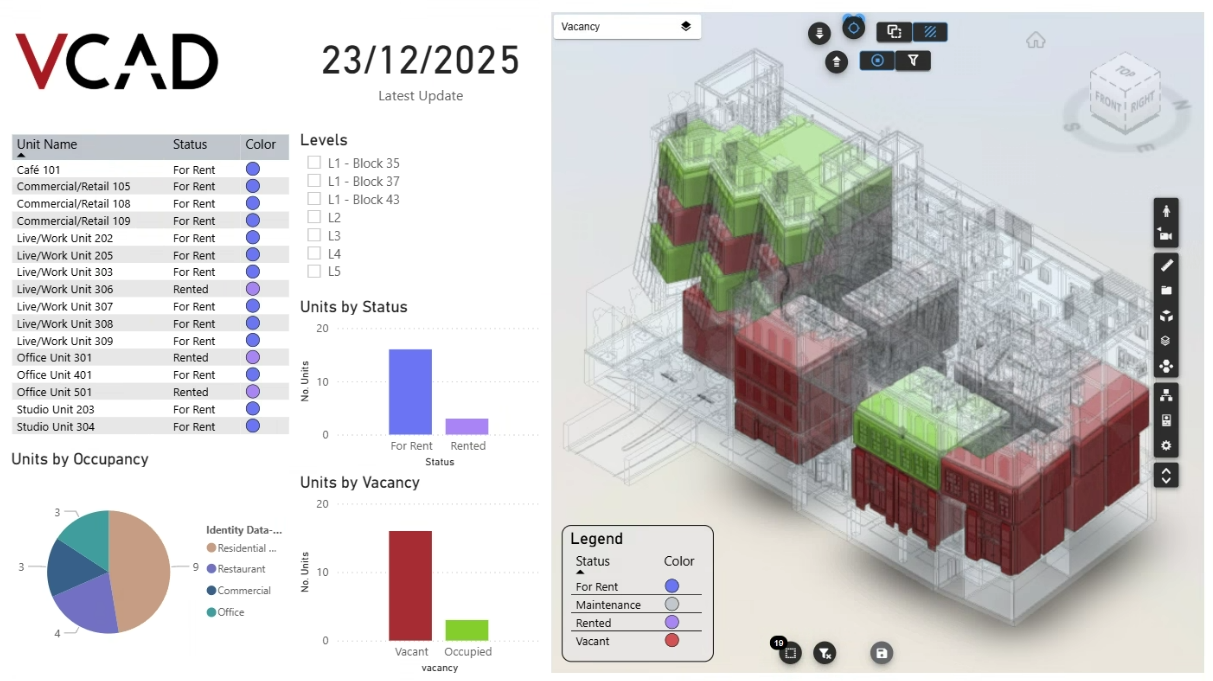
Latest Data View
The report includes two pages focusing on the latest data available for rental and sale units. The embedded Vcad model is color-coded to reflect the latest unit status.
Users can filter the model by floor or use the charts to highlight all units of a given status.
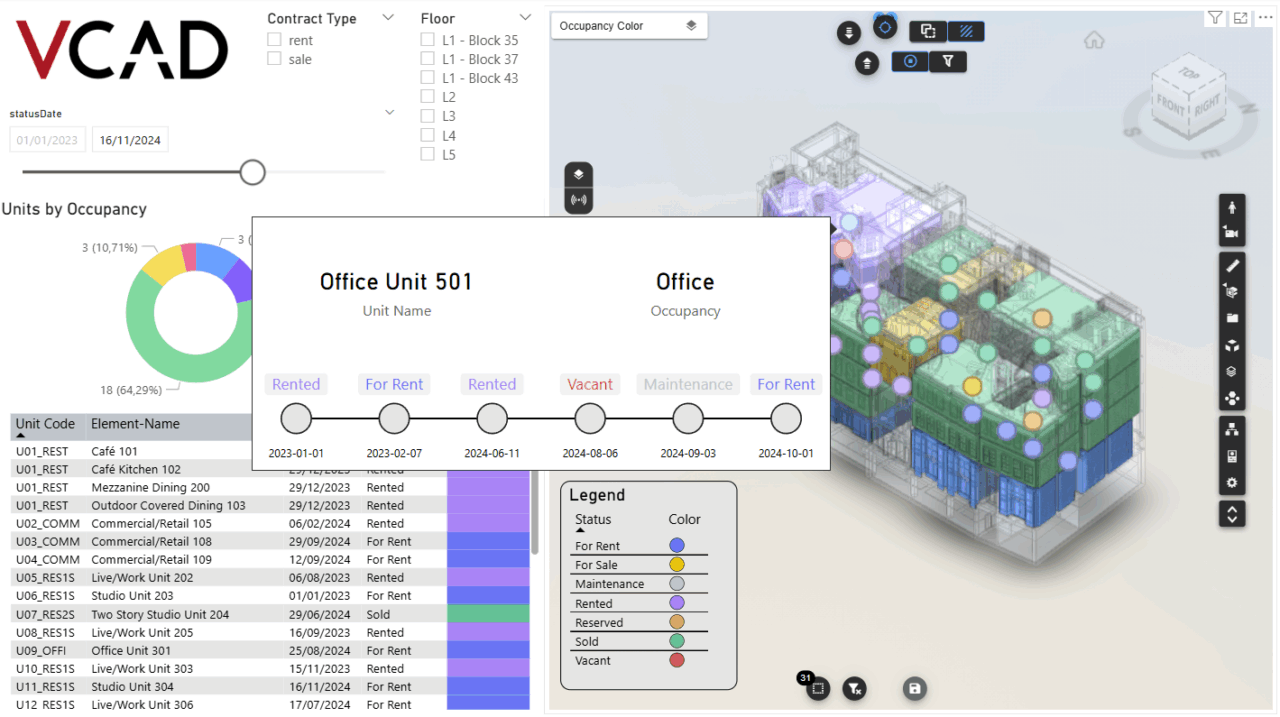
Historical Data 3D View
The second page allows users to explore the timeline of unit status changes. By using a DateTime slicer, it’s possible to select a specific point in time and display how units appeared at that date, whether for sale, reserved, rented, or under maintenance.
This enables users to analyze historical availability trends and compare occupancy patterns across months or years.
In this case, not only can units be highlighted with different colors in the 3D rendering but additional icon can make interacting with the rooms easier and give the user access to a dynamic tooltip containing a recap of the unit’s history.
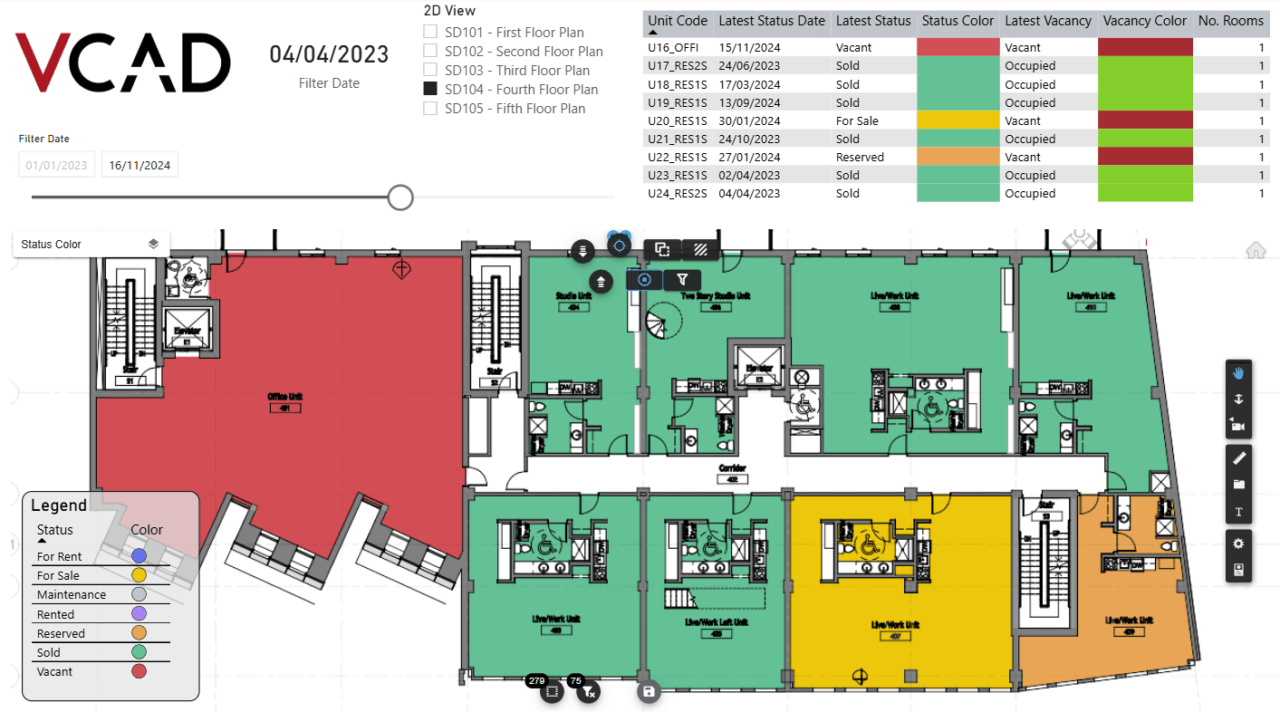
2D Floor Plan View
For a more detailed inspection, the 2D plan view highlights units per floor, providing a clear view of occupancy distribution.
The integration with Vcad datasets ensures that BIM metadata, such as element names, levels, and unique identifiers, are directly connected to analytical data in Power BI. This guarantees consistent, model-driven insights with no manual synchronization required.
The Power of Vcad Integration
At the heart of the report lies the Vcad dataset and model rendering capabilities.
By linking BIM elements to Power BI data, Vcad enables interactive filtering and real-time visual feedback, selecting a unit in the model instantly filters the associated data in the report, and vice versa.
This level of integration transforms complex datasets into a visual management tool, making it easier to communicate insights across technical and non-technical teams alike
Conclusion
The Unit Lifecycle Report is a powerful demonstration of how Vcad can bring BIM intelligence into real estate analytics. By combining 2D and 3D visualization, data filtering, and temporal analysis, it provides a dynamic and intuitive way to understand how properties evolve over time.
Whether used for sales tracking, rental management, or facility maintenance, this solution highlights the value of connecting data to geometry, turning every model into a living dashboard.