The methodological approach to support the management of infrastructure networks
Elisa Spallarossa, BIM Manager e Amministratore ARCHIMEDE S.r.l.
Giuseppina Broggi, Engineering Tools Project Manager in SINA S.p.A.
The article describes the activities carried out within the pilot project of integration between the current Asset Management system of SINA and the Digital Twin of the work, with the introduction of new “BIM dimensions” and the preparation of a structure able to accommodate real physical data on the digital twin model. The project, promoted by SINA S.p.A. – Engineering Company of the ASTM Group, has been realized in collaboration and thanks to the specialized skills of ARCHIMEDE S.r.l.
The objectives of the pilot project are the development of structured and innovative methodologies for the dynamic management of infrastructures using digital twins, the management of scheduled maintenance of freeway bridges and the setting up of a BIM-oriented Asset Management platform for the determination of predictive maintenance specifically for SINA, i.e., for the Concessionaires belonging to the ASTM Group. This platform is used as an enabling technology for analyses aimed at managing sustainability and safety (BIM 7D and 8D dimensions) for the individual existing works and for their infrastructure network. The pilot has been realized keeping in mind also the principles contained in the Guidelines for Risk Classification and Management, Safety Assessment and Monitoring of Existing Bridges of the MIT published early 2020.
The article describes methodologies, operational practices, risks and opportunities in the application of digital methods and tools (asset modeling with BIM tools, collaboration platforms, dashboards, setting metrics to support Asset Management Systems, etc.) for the realization of the project and the achievement of its objectives.
Introduction
ARCHIMEDE S.r.l. and SINA S.p.A. have implemented, since 2001, decision support tools for the management of infrastructure networks.
The collaboration, born to be able to use the data collected with the detailed SINA inspection methodology, allowed to apply Bridge Management Systems (BMS) on the networks managed by the ASTM Group, among which the BMS system developed by AASHTO (American Association Of State Highway And Transportation Officials).
Following the publication of the recent Guidelines of the Ministry of Transportation in 2020 for risk classification and management, safety assessment and monitoring of existing bridges, which introduce, along with the multilevel approach of safety audits, also BMS systems and BIM modeling, the two companies have developed the pilot project described in the article that combines the experiences gained in these areas and adopts a “multilevel criterion” also for BIM modeling.
The main purpose of the pilot project was therefore to structure a methodology for the reorganization of the information currently present in the SINA BMS platform, to be used as a decision-making support for inspectors, technicians, managing bodies, safety control agencies, extending the methodology of representation and organization of the data both to the entire heritage (infrastructural works and networks) managed by SINA and also to other infrastructural assets.
The pilot project: the BIM modeling for the creation of the digital twin of the asset in the inspection area, the integration with the SINA Works Inspection System (SIOS) and the evolution of the related Bridge Management System.
The aim of the pilot project is to integrate the current Bridge Management System of SINA, whose information is based on the SINA Works Inspection System (SIOS), and the digital twin model, realized following the indications of the BIM methodology.
The main objective is the development of a methodology for the dynamic management of infrastructures, ordinary maintenance and predictive maintenance, with a view to Asset Management. To do this, the team of specialists coordinated by Archimede S.r.l., has deepened the methodology of modeling data of visual inspections on some viaducts, for which BIM models made using Autodesk Revit were already available, even if developed with design type modeling objectives. These models have been, therefore, modified and updated to obtain the level of information needs (LOG, LOI, documentation) useful for the digitization and modeling of inspection data (MODEL USE: INSPECTIONAL/ MANAGEMENT/ASSET MANAGEMENT).
Further activities carried out to achieve the project objectives were the experimentation of different technological solutions and operational tools, as well as data management modalities deriving from inspection data flows and the creation of a decision support system from a BMS point of view, with the added value, from the point of view of managers, inspectors and technicians, of the identification of the best technological solution to be able to visualize and query both BIM models and the information connected to them, without the need of specific modeling tools.
Main activities
The activities carried out, in the realization of the pilot project and on the basis of the prefixed objectives, were, in extreme synthesis, the following:
- Preparation of the database (WBS, parameterization and creation of templates) in order to define an approach that can be adapted and adopted for several types of works and structures (from the point of view of Asset Management);
- updating of BIM models for inspection purposes, with contextual definition and implementation of guidelines for the modeling of works. This approach aims to be able to integrate the BIM model with the inspection data (alignment between the elements model and the coding used in the inspection);
- creation of parameters for the recording and modeling of anomalies;
- identification of a modality for visualization of the inspection data on the models, through the development of an appropriate collaborative platform;
- integration of the BIM model with the geometric modeling of the anomalies recorded during the inspection activities in Microsoft Power BI, through the application Vcad;
- definition and creation of dashboards supporting the visualization and analysis of the structure of the work as well as the anomalies detected on the inspected elements;
- processing of inspection data for BMS purposes, in particular for the definition of metrics for the evaluation of the health index (HEALTH INDEX);
- Identification of appropriate dashboards to visualize the BIM data and the degradation data mentioned in the previous points, to provide a decision support tool in view of Bridge Management with setting predictive analysis, budget management and service levels.
Operational tools used
The operational tools used were:
- Autodesk Revit 2020 and 2021 for viaduct modeling,
- Microsoft Power BI as a business intelligence tool for data management and dashboard visualization,
- Vcad by Blogic s.r.l. for the integration of models in Microsoft Power BI,
- Solibri Office for the visualization of the models in IFC format and of the elements in the different service states and for the creation of appropriate quantity takeoffs to support the inspection.
The current SINA Works Inspection System and its BMS (SIOS)
SINA, for the execution of the works inspection activity is based on its own method – SIOS – which provides for the punctual recording (type, extent, severity and position) of the deterioration of each typical element of the bridge (or other work present on the infrastructure) and the assignment of a punctual deterioration level indicator for each element and for each subsequent level of aggregation of the elements (both physical by span and work, and logical, by structural type of element and spans) which finally defines the state of the bridge with a value that allows to compare all the works of an infrastructure or other infrastructure networks.
The SINA inspection method, supported by IT solutions developed ad hoc, allows to
- have detailed and objective inspection data for each element of the work, also complete with graphic representation of the elements and the degradations detected;
- have a historical archive (searchable database) of the degradations and of the calculated degradation levels, in order to monitor the evolution over time and to prepare forecasts on the evolution of these values;
- order, group, average, determine maximum and minimum values and perform statistical calculations on both elements and defects and indicators of degradation levels of individual elements, groups or the work as a whole;
- define the actual state of the structure, using degradation level values, evaluating the context in which the work is located, the severity of the environment and also on the basis of the results of special tests on materials and, possibly, of special technical investigations;
- to define the priorities of intervention in the short/medium term according to: representative indices of the states of condition of the structural elements, statistical processing of index values and analysis of historical series;
- to have useful data for the analysis of the costs of repair works and the relative quantification.
BIM modeling for creating the digital twin of the asset in the inspection environment
WBS and Baseline Data Preparation
The inspection BIM model WBS in Autodesk Revit was structured based on the eight-level SINA convention. The use of the data structure already present in SINA in the current BMS has facilitated the data preparation activities, so the objects present in the models have a parameter related to the SINA work element code as encoded in SIOS and from here the use of the data structure present in a relational DB for the construction of dashboards in Power BI at various levels of detail: from the work as a whole to the single specific anomaly detected during the inspection in a given year. Compared to the SINA data structure, however, it was decided to include some intermediate levels of aggregation of data and objects to meet the needs of assessing the state of health of the work and the analysis of the evolution of degradation and criticality, for example: aggregation of elements according to structural characteristics (superstructure or substructure) and not only by element type.
The structure of the WBS – as we will read later – has been used to reorganize the input data model for the modeling of anomalies for each type of element in the BIM models of the bridges of the pilot project, as well as for the creation of special dashboards in Microsoft Power BI with which a user (inspector, manager, technician, depending on the needs and access rights) can have immediate and intuitive visibility of each element, of the types of elements and of the analysis of the deterioration. of each element, of the types of anomalies found during the inspections, both for the structural elements and for the ancillary works.
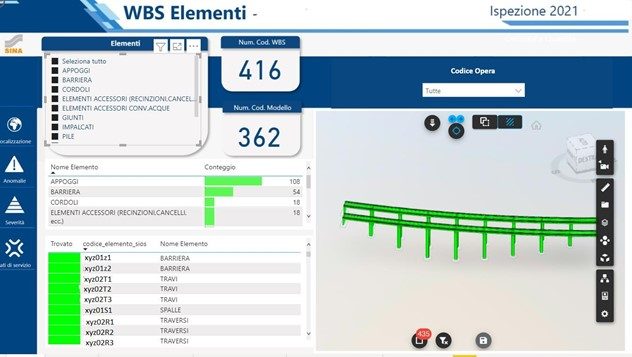
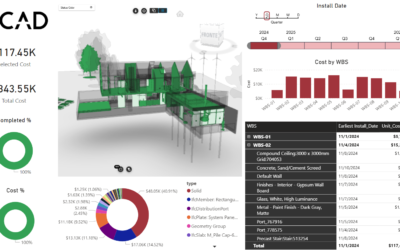
Figure 1 – Dashboard “WBS” with all the selected elements developed in Power BI and integrated with the Revit model visualization thanks to the VCad component.
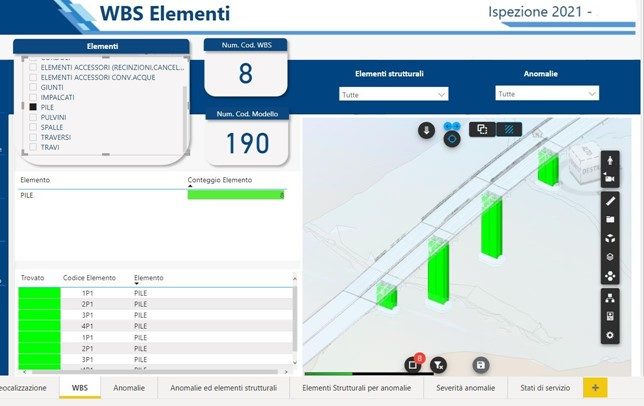
Figure 2 – detail of the “WBS” Dashboard with visualization of the WBS with filter applied on objects classified as stacks
BIM model of the work for inspection purposes
The BIM models of the work created for design purposes used for the pilot project were adapted for “inspection” purposes following the settings given by the definition of the WBS and the SINA convention regarding the definition of the elements subject to inspection.
The information data managed and stored in SIOS have been inserted as parameters both for the characterization of the elements and for the definition of the anomalies in Autodesk Revit.
The data model (AIM – Asset Information Model) has been specifically structured to allow the management of the information deriving from the inspection activity, but it is still integrable, for the design phases, by setting up also special information sheets for each element. Specifically, the data model allows to
- Modify, delete and manage categories in full freedom, remaining independent from categorizations imposed by specific software (Revit).
- Set up the organization of information based on the reality of the Client to share
the entire supply chain of SINA. - Comply with regulations in terms of OpenBIM and open formats.
The result of this activity was the definition of guidelines and operating instructions for the creation of models for inspection purposes and developed with a view to “systemizing” the methodology on the works managed by SINA with the SIOS system.
Degradation modeling strategies
For the activities of the pilot project, in order to verify both the feasibility and the opportunity of integration between the data present in the SIOS system of SINA and the BIM model, different modeling strategies have been experimented according to :
- level of detail of the treated data;
- evaluation of the “cost-benefit” of the application of the different modelling methods in function of the objective
The SIOS inspection model of SINA foresees the detailed detection of the anomalies found through visual and/or instrumental observation, i.e. the objective indication of the type of degradation, its severity and extension, the latter quantified thanks to the digitalization of the anomalies on 2D graphic schemes representing the single elements, with the integration of geometric and material tests.
In the light of the data present in SIOS and their level of detail, for the representation on the BIM model, various strategies of digitization of the anomalies have been experimented, both geometrically and with informative parameters, recording pros and cons of each, and then arriving at the actual application of two possible methods.
This methodology approach was also crucial to allow alignment of the informative data with the parametric data and the bidirectional data/model query.
The first experimented method involved the digitization of all the anomalies, both geometrically and with informative parameters, replicating on the 3D model, even if in an approximate way, the area and the position of the anomaly detected and recorded on 2D.
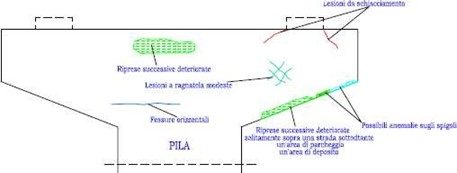
Figure 3 – Example of 2D graphical representation of the pulvinus element of the information collected in inspection
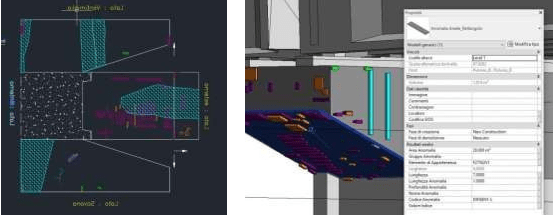
Figure 4 – Example of the transposition of the anomalies from the 2D dwg file (with the inspection diagram of the pulvinus development) to the BIM model on Revit
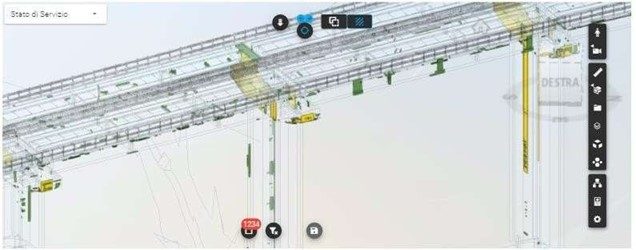
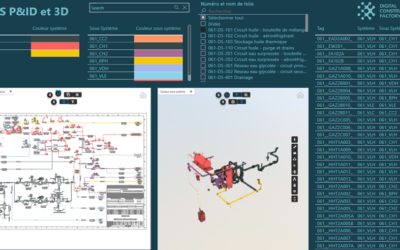
Figure 5 – visualization of the pilot project viaduct, with modeling and location of all anomalies recorded during the inspection. All anomalies found during the visual inspection of the first viaduct and reported in the inspection form were reported on the model, so that they could be queried, filtered also with Power BI.
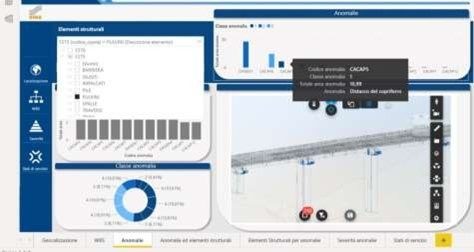
Figure 6 – “Anomalies” Dashboard of the pilot project, with modeling and location of all anomalies. In the example, the filter on the pulvinus elements has been selected and the label summarizing the information for each anomaly has been highlighted; in the selected case it is the detachment of the concrete cover.
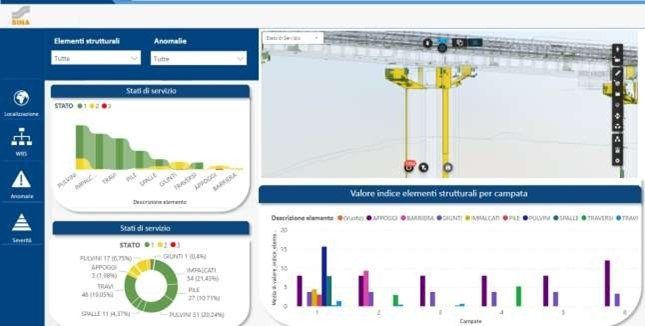
Figure 7 – “Service States” Dashboard
The second method, on the other hand, has leveraged one of the features of the SIOS method which entails the calculation of an indicator of degradation level determined on the basis of the anomalies found, their characteristics, extension and severity for each single element. The data thus assigned to the element has allowed the connection to the 3D model and the use of the indicator as a parameter of visualization and interrogation of the information, without the necessity of the geometric modeling of the single anomalies. In this second case the anomalies are inserted as informative parameters associated to the elements themselves.
The second approach was functional for the use of the information from the BMS point of view, which foresees to associate to the different degradations detected during the inspection (according to extension, typology and severity of the damages) corresponding states of service, unifying the inspection data at structural unit level, that is, aggregation at the level of bridge elements belonging to the same construction type (construction characteristic of the spans) and structural type (superstructure, substructure, other elements).
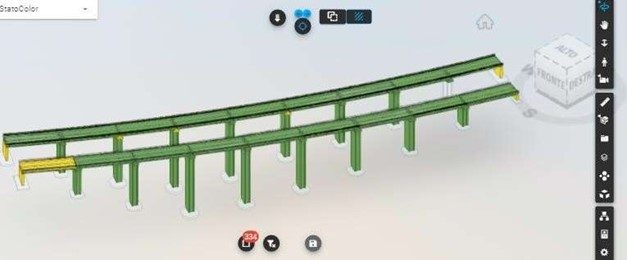
Figure 8 – Visualization of the pilot project viaduct with modeling and visualization of distinct elements based on the degradation level indicator. The color represents the state of service in which the elements fall.
The evolution of the SINA BMS: setting up indexes to support decision-making processes in a BMS perspective
In order to verify the technologies identified and used during the pilot project and the integration with the systems already adopted in SINA, in addition to the model integration with the inspection data, the calculations of two indices were set up, useful for the subsequent extension of the pilot project from a BMS point of view. These are the health index and the index quantifying the asset value.
The index of health of the structural elements and of the work
The Health Index (or HI) is an indicator at the level of elements aggregated by homogeneous structural type and at the level of the work as a whole that provides a level from 0% (worst possible condition) to 100% (equal to as new) of the state of the object under analysis.
The index is calculated according to the service states assigned to the single elements of the work and to the structural typology of the element itself, which determines the number of service states applicable to the element itself and conditions its distribution. In a simplistic way it can be stated that the health index of the work as a whole is the weighted average of the health indices of the elements constituting the bridge itself.
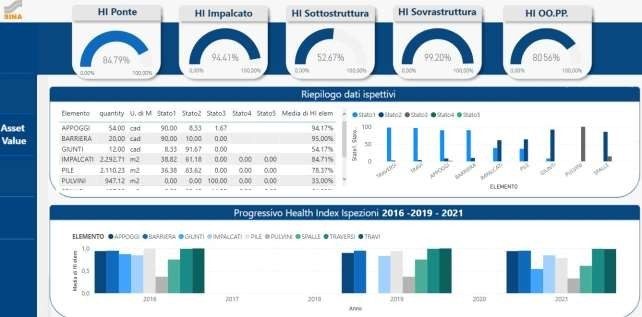
Figure 9 – The “Health Index” dashboard, with the setting of the values with different subdivisions: by groups of structural elements (deck, superstructure, substructure and accessory elements), by single element, by element category, with setting of the Health index trend according to the different inspection years. Note: for the pilot project, the values of the 2016, 2019 and 2021 inspections were included for the viaducts under consideration.
The Asset Value
What is interesting for the Managers of infrastructure networks is the conversion of the Health Index of a work in monetary terms: in order to convert the variation of the Health Index, and use it in BMS elaborations, the Asset Value (AV) parameter is introduced, intended as the Patrimonial Value of the work or of the asset in general.
During the project, given the criticality related to the determination of an asset value, it was decided to develop an AV as the sum of the economic values associated with the elements that make up the bridge.
The asset value can also be calculated as the replacement cost of the whole work or the sum of the replacement costs of all the elements of the work itself. This approach has been made with a view to the subsequent developments and interactions of the bridge management system. Pending further investigation, on the basis of the elaborations and experiences of BMS made previously by ARCHIMEDE S.r.l. and SINA S.p.A.
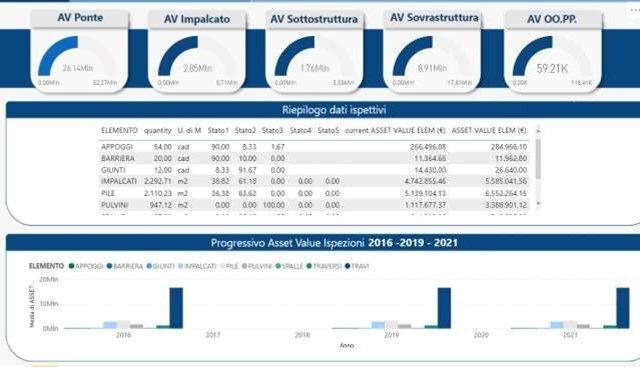
Figure 10 – The “Asset Value” dashboard, with the setting of the values with different subdivisions: by groups of structural elements (deck, superstructure, substructure and accessory elements), by single element, by element category, with setting of the Asset Value trend according to the different inspection years. Note: for the pilot project, the values of the 2016, 2019 and 2021 inspections for the viaducts under examination have been included
Simplified integration between model, data and maps: Microsoft Power BI and VCad
At the pilot project level, the opportunity has been taken to experiment new and simpler integration systems between model, data and maps for geolocation and to try alternative solutions to those already in use in SINA, but which aim at satisfying the information requests of very technical users and insiders, operating daily on the works and on the network.
The experimentation had as objective to expand the possible users of the information, targeting both the technicians who provide safety analysis and planning of inspection and maintenance activities, and higher decision-making levels.
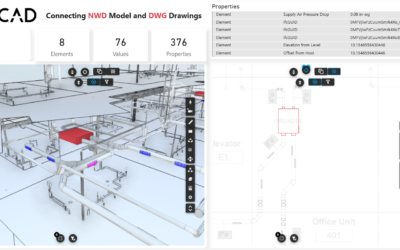
The solution identified by ARCHIMEDE was the integration of Microsoft’s Power BI application and Blogic’s VCad with the information structure of SINA. Specifically, this multi-application solution allows you to create a space dedicated to the visualization and query of the BIM model in a dynamic way, taking advantage of the WBS setting.
Operationally, the WBS and Revit models were loaded into Power BI and the former was associated with the model thanks to VCAD. This operation enabled the possibility to visualize both graphically in the model and through description, the parameters set in Revit, for all necessary data related to the dealership: geometric data and inspection data. Specifically, on the latter the anomalies on each structural element and the service status of the same are displayed.
Power BI is also the enabling solution for the creation of Dashboards, in order to provide a tool to be used within SINA that allows the necessary information to be visualized quickly and dynamically:
- the inspection group is interested in the status of inspections on each structural and non-structural element,
- while the group in charge of evaluating the state of health of the work and defining the indications for maintenance activities is interested in visualizing the distribution of the states of service.
Reviewing the activities carried out for the definition of the mode of digitalization of the anomalies, Power BI and VCad are to be considered as the key for the application of the strategy that foresees the visualization of the elements by service states and not the punctual digitalization of every single anomaly detected. Such formulation in fact enables the interrogation of the model based on the elements, inserting the anomalies like informative parameters associated to the elements themselves.
Power BI and VCad allow, if the complete digitization strategy of the anomalies is applied, the visualization of the digitized anomalies on all the elements of the viaduct, the interrogation of the single anomaly (if modeled also graphically), with the update and the dynamic navigation in real time, according to the elements or the anomalies selected on the model or on the dashboard.
An example of data integration through Power BI was the management of geolocated information. In order to test the management of registry and inventory information within the project, a special tab was set up to geolocate the work in the geographical context, to propose links to the various data sheets, if available, all connected to the 3D model of the work.
Interoperability
Regarding the BIM modeling of the viaducts object of the pilot project, to ensure interoperability with SINA, ARCHIMEDE S.r.l. has prepared and tested the export in IFC format, as well as setting on a model checking tool, such as Solibri office, appropriate classifications and ITO (Information Take Off), thus providing and setting, also, an alternative means of visualization and interrogation of the models, independent from the authoring tool and accessible also to technicians not necessarily BIM oriented.
For the information modeling, a hierarchical decomposition (IFC Site, IFCFacility, IFCFacilityPart, IFCElement) has been realized using the IFC 4.3 standard, creating appropriate ifc export files and guidelines to support the process.
Finally, the free Solibri Anywhere viewer, allows you to view and query models in IFC format, like other IFC viewers, but also allows you to access models in Solibri format (.smc format), thus providing the possibility to view models according to the classification rules and Information Takeoff set with the tool itself.
This option could be adopted when fully operational, once the information flows and the best information sharing system have been identified.
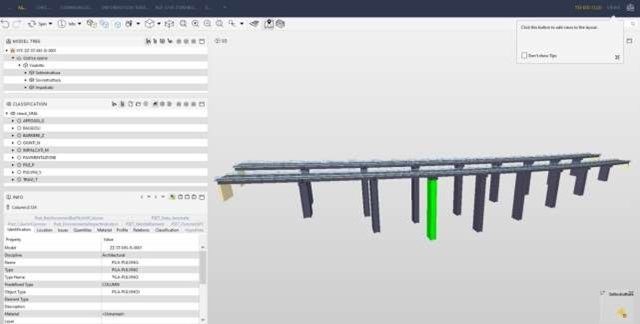
Figure 11 – One of the viaducts in IFC format, note the hierarchical setting, which follows that of the IFC
4.3 for infrastructures.
Solibri checks (code checking) and IFC format visualization
In order to check the correct setting of the export in IFC format, the models have been opened and checked with Solibri office, after having created specific Solibri classifications and rules with the free tool Solibri Anywhere.
This tool provides not only geometric controls (clash detection, which in the case under consideration is used to verify the correct setting of the elements), but above all the control of the correctness of the information parameters, such as, in the case under consideration
- subdivision of the elements according to the predefined hierarchical decomposition;
- association of the Revit category with the corresponding IFC category;
- association of parameters to objects.
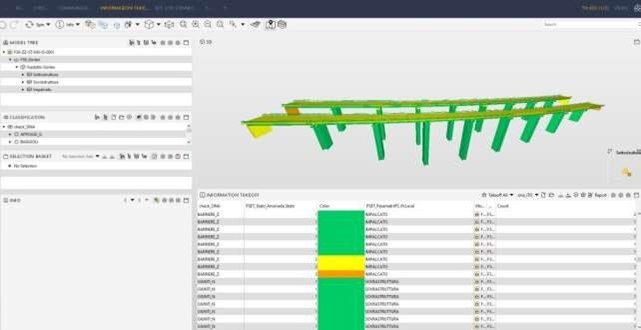
Figure 12 – The Solibri ITO display for identifying the service states associated with each element
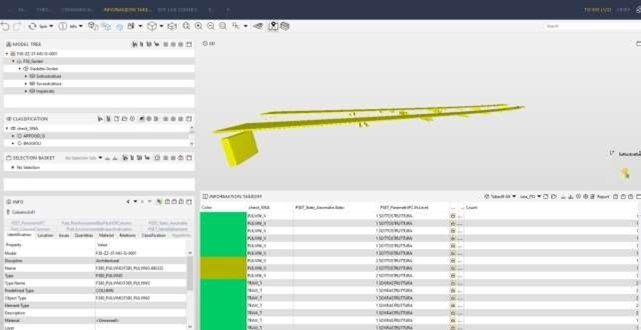
Figure 13 – Solibri ITO visualization for the identification of all the elements in state 2 of the viaduct object of the pilot project
Conclusions
The achievement of the objectives of the pilot project allowed, in this first phase of experimentation and study of new methods and technologies, to define
- the procedure for creating BIM models with related levels of information requirements for the purpose of digitizing visual inspections according to SINA conventions,
- the identification of possible indices for the development of a BMS system that includes the entire infrastructure.
In this regard, the criteria at the basis of the calculation of the indices supporting the SINA Bridge Management System will have to be studied in depth, so that they can be applied to the entire managed information assets (Asset Management) and aligned with the conventions defined within the MIT Guidelines. Thanks to the experience gained with the development of the pilot project, the transition of the SINA inspection data to the BIM models can be standardized, possibly speed up with the development of automated processes (e.g. using DYNAMO scripts or other specific applications) and using information contained and validated in other specific databases present in SINA.
Future developments
In order to further expand the approach adopted from an Asset Management perspective, a new pilot project on tunnels will be set up, defining the necessary information requirements, and testing decision support criteria for all categories of works.
Another in-depth study will concern the health and asset value indicators (on the whole network or on groups of works) to enable analysis and prioritization activities, for which the definition of the calculation methods and the conventions adopted for the definition of the indicators when extended to the whole network, leaving to the pilot case the purpose of evaluating the applicability of the method and the dashboard architecture in Power BI.
In addition, one of the next developments and objectives will be to provide back-office technical information to inspectors in real time.
After having set up the database of geo-referenced information models and having modeled the “digital twins” there is a plan to implement the methodologies to perform inspection activities also through the use of VR and AR, in particular to:
- Support inspector training activities using both information models and VR simulation in order to create a learning environment in which to train inspectors;
- Modify the inspection rules moving from the classic visual inspections to new and improved inspection surveys, this by developing an AR environment with the aim to provide, in real time, technical back-office information to inspectors overlaying over the structure the “digital twin” with the history of degradation;
- Introduce a remote inspection service with the dual objective of supporting the inspector activities in the field with all the necessary skills of specialized back office engineers, and promoting an advanced first experience of total remote inspection services, using remote inspection devices (such as drone, scanner, autonomous vehicle, remote video surveillance etc.).
With the collaboration of
Marco Maffoni – CIO at SINA S.p.A.
Giuseppina Broggi – Engineering Tools Project Manager at SINA S.p.A.
Rachele Manili – Engineering Tools & AMS (SIOS) Specialist at SINA S.p.A.
Biagio Cannizzaro – BIM Manager at SINA S.p.A.
Elisa Spallarossa – BIM Manager and Administrator at ARCHIMEDE S.r.l.
Fabio Cimmino – BIM coordinator at ARCHIMEDE S.r.l.
Chiara Pitruzzelli – Civil Engineer at ARCHIMEDE S.r.l.
Giovanni Livi – CEO of Blogic S.r.l.
Francesco Ruperto – CDE Manager of Archificio
Beatrice Pagnotta – CDE Specialist of Archificio
Translation of the article published by Ingenio-web.it
Link https://www.ingenio-web.it/33267-digital-twin-e-asset-management-system-lapproccio-metodologico-per-la-gestione-delle-reti-infrastrutturali